最新文章
文章分类
归档
2006 (191)
2007 (288)
2017 (1)
2020 (1)
2021 (1)

正文
At the beginning of every month, I calculate the value of the propriatary "Investment Value Index" for each of the following five major asset classes represented by their respective ETFs: cash (SHY), long-term Treasury bonds (TLT), gold (GLD), stocks (SHY), and real estate (IYR). Then I allocate 50% of the capital to each of the two ETFs with the highest value of the "Investment Value Index".
For example, suppose at the beginning of February 2012, the two assets with the highest value of the "Investment Value Index" would be cash and long-term Treasury bonds, I would allocate 50% of the capital to SHY and the other 50% to TLT. If at the beginning of March 2012, the two assets with the highest value of the "Investment Value Index" change to gold and long-term Treasury bonds, I would exchange SHY to GLD, and continue to hold TLT.
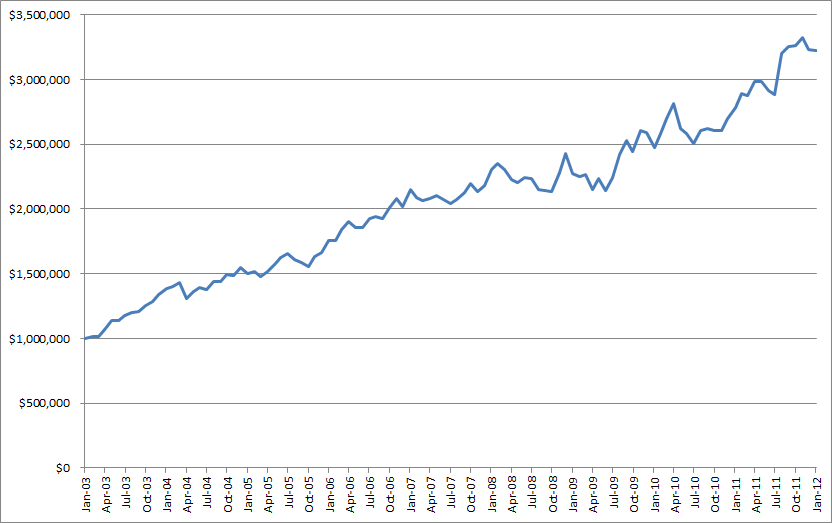
The equity growth curve from January 2003 to December 2011 is as follows:
A few parameters of the ETF Asset Management System are:
Investment vehicles: ETFs of five major asset classes (SHY, TLT, GLD, SPY, and IYR)
Annualized return: 13.9% (from January 2003 to December 2011)
Peak-to-trough equity drawdown: -11.9% (from November 2008 to May 2009)
Numbers of trades: 42 times in 9 years (average 4.7 trades per year)
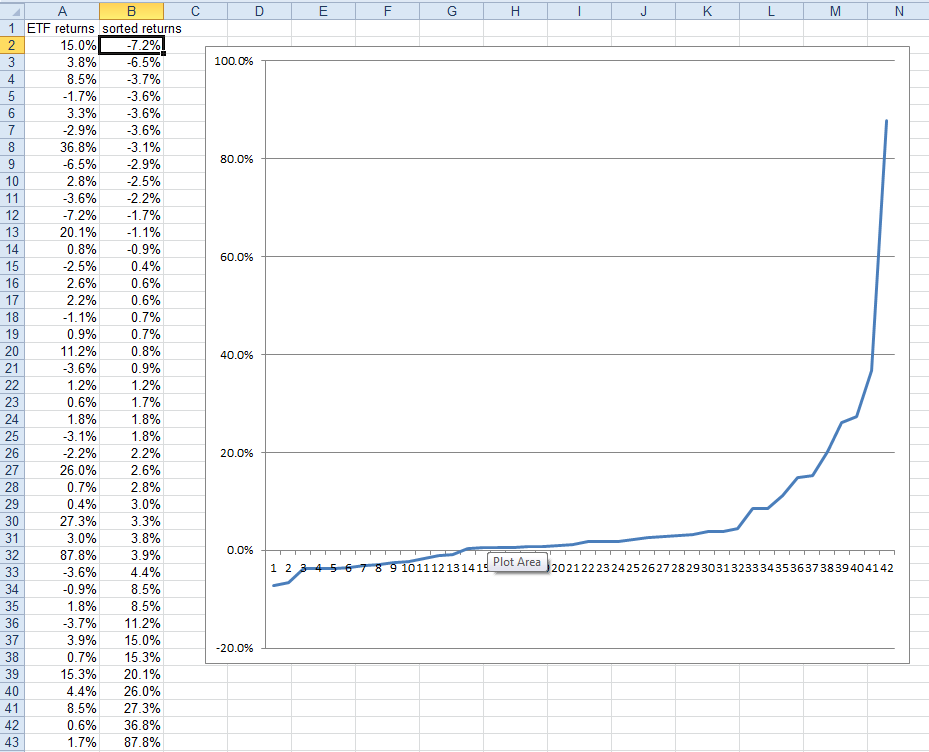
The profit/loss profile of the completed trades is as follows:
Among the 42 trades, 28 were profitable, 14 were losses. The average profit per trade was +10.1%, the average loss per trade was -3.3%. The highest profitable trade was +87.8%, the largest loss trade was -7.2%.
In summary, the ETF Asset Management System is a 100% quantitative and mechanical investment system. It holds only 2 of the 5 ETFs of major asset classes at any time. It is simple, easy to follow, and trades fewer than 5 times per year on average. Above all, it fulfills the ultimate winning investment principle of "cut losses short, let profits run".
Disclosure: I hold 2 of the following 5 ETFs at any given time: SHY, TLT, GLD, SPY, and IYR.
=========
My investment blogs:
http://murmuronhudson.blogspot.com
http://blog.sina.com.cn/murmuronhudson
http://blog.wenxuecity.com/myindex.php?blogID=48731
评论
目前还没有任何评论
登录后才可评论.


