


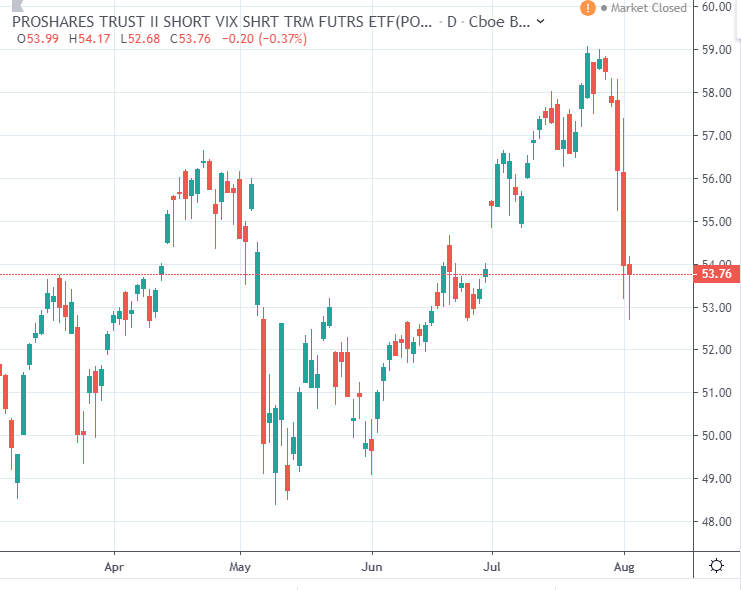
Over the last month, we've seen shares of the ProShares Short VIX Short-Term Futures ETF (SVXY) drop by about 5% due to a strong fall of about 9% in the prior week.
In this piece, I will explain this drop in SVXY as well as discuss why I believe now is an excellent time to take the long side in the instrument.
Methodology
When investing in volatility notes and ETFs, it pays dividends to examine the actual methodology employed by the instrument. There is significant nuance in the construction of volatility notes, and the fine points of specific methodologies can result in substantial differences in return.
When it comes to SVXY, it is an instrument which seeks to give one-half the inverse of the daily performance of the S&P 500 VIX Short-Term Futures Index. It seems simple, but there's a lot to unpack here.
The S&P 500 VIX Short-Term Futures Index is an index which shows the return of continuously rolling a position across the front two VIX futures contracts provided by the CBOE. VIX futures are non-deliverable/financially settled futures contracts which settle based on the S&P 500 VIX index. The VIX index is an index which uses the implied volatility of 30-day options on the S&P 500 to derive a barometer of potential future volatility of the index. As a general rule, the further extrapolated you are from the underlying concept which you're trying to trade, the more attention you need to pay to fine details. In the case of SVXY, when you trade its shares, you are actually trading something several layers removed from underlying stock market volatility so an understanding of the above process and its implications will reap dividends.
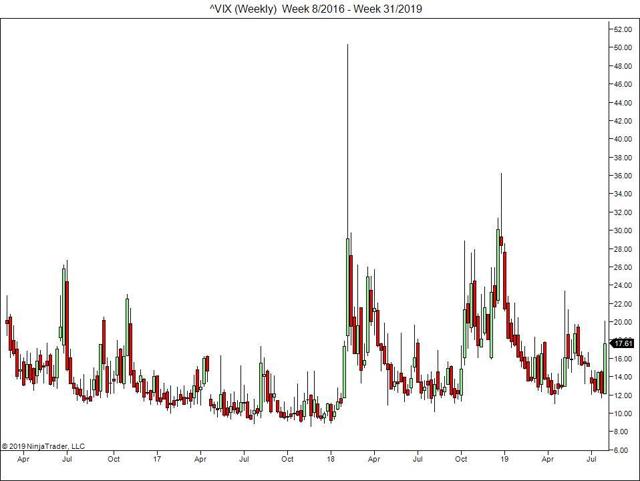
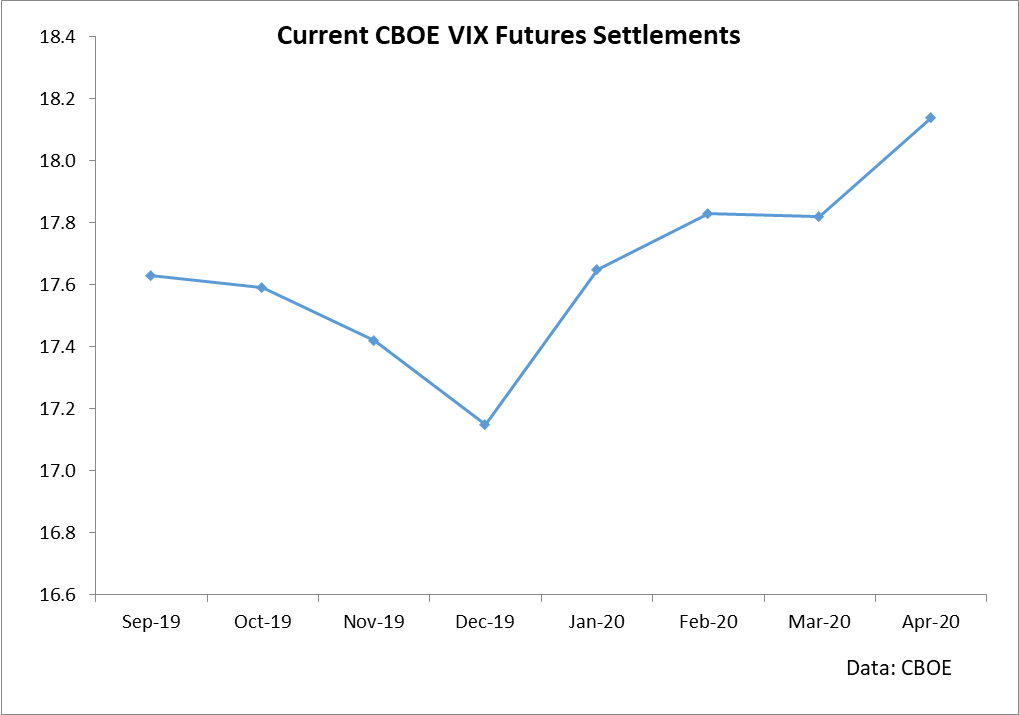
In the specific methodology of SVXY, it is highly exposed to the structure of VIX futures contracts. Specifically, roll yield plays the primary role in the large general uptrend seen in prices. The reason for this is that VIX futures are largely in contango until brief periods of time in which the VIX rises. As you can see in the following two charts, we are currently in a period of rising VIX and a backwardated VIX futures market.
The reason why shares of SVXY are falling is not just that the short VIX position is losing money, but also roll is negative for a short position.
Roll yield is the gain or loss associated with holding a position across the future curve. Specifically, there is a general tendency for prices in later months on the futures curve to trade towards the front month as time goes on. This means that if you have a short position in a contango market (back prices above front prices), you generally earn positive return on your short as you shorted at higher prices which drift towards the front month as expiry approaches. In a backwardated market, a short position will result in losses since the short will be established at lower prices and trade up as time approaches expiry.
The reason why SVXY increases most of the time is that VIX futures are in contango most of the time. The general expectancy of the market is that future volatility will be higher than present volatility and until market panics come along, VIX generally remains low and structure largely remains in contango.
Last week, we had two events which drove VIX higher. The first of these events was the Fed's rate cut. This in and of itself was not a cause for unusual volatility in that the market expected exactly what happened: a rate cut. However, as you can see in an intra-day chart of the S&P 500, the market was unhappy with Powell's comments regarding an insurance cut rather than the hopes for a series of cuts to stimulate the economy.
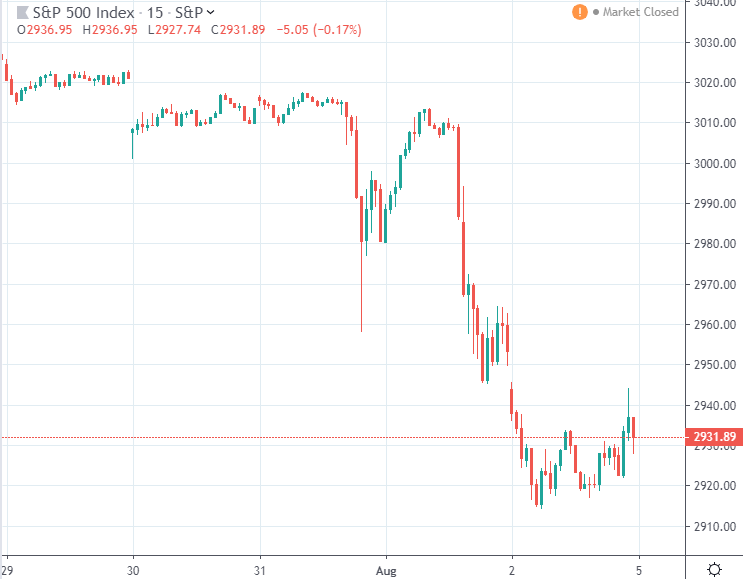
The other driver of volatility in the markets was President Trump's tweets the following day regarding an additional 10% of tariffs on China. These two events are the two large periods of selling in the chart above and the reason for the surge in VIX. Investors who are able to gauge market sentiment accurately definitely can have an edge by trading these events; however, I've found that understanding general VIX tendencies results in a long-term edge over market drift.
Volatility
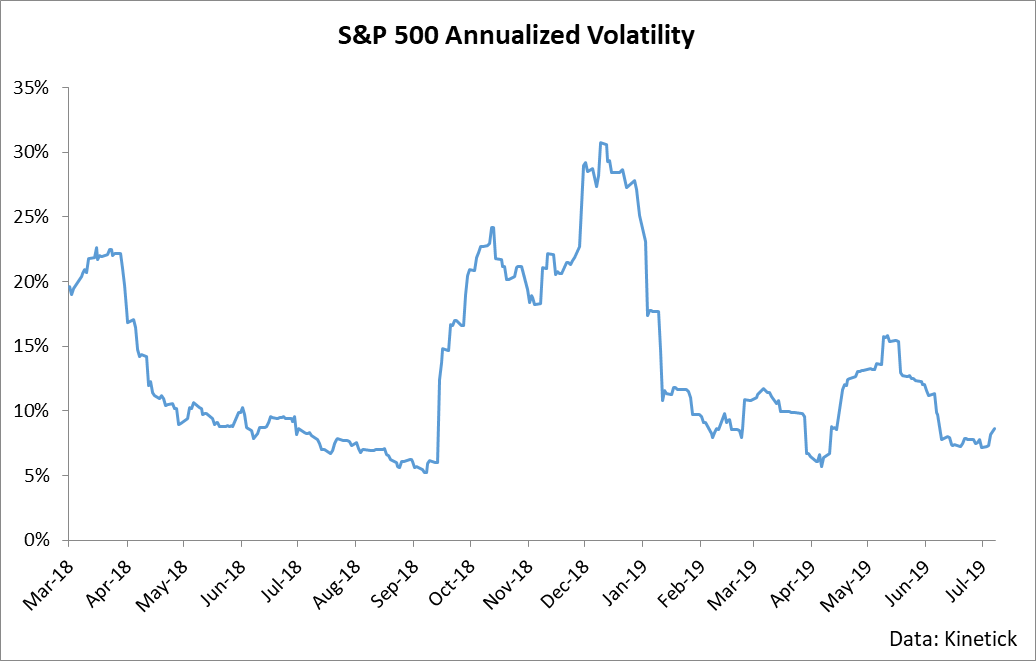
The nature of volatility is mean reversion. If you think about it, this makes sense. Unlike equity markets, there is no general upwards drift in volatility since volatility is simply an expression of the variance of price changes. If you were to look at a long-term chart of annualized volatility, you would find that it largely just moves sideways punctuated by brief periods of spikes and brief periods of unusually subdued volatility.
The general sideways drift in volatility is where SVXY shines. The nature of the instrument is that it maintains a half short position across the front two months contracts, which means that when volatility is either falling or trading sideways, SVXY wins from the roll or the decrease in VIX. However, the primary driver of returns for a short VIX futures position is the roll since VIX largely trades sideways over lengthy periods of time.
The nature of mean reversion of volatility can be seen through a simple examination of the outright level of volatility in the market and the percentage of time that volatility is higher or lower 50 days into the future.
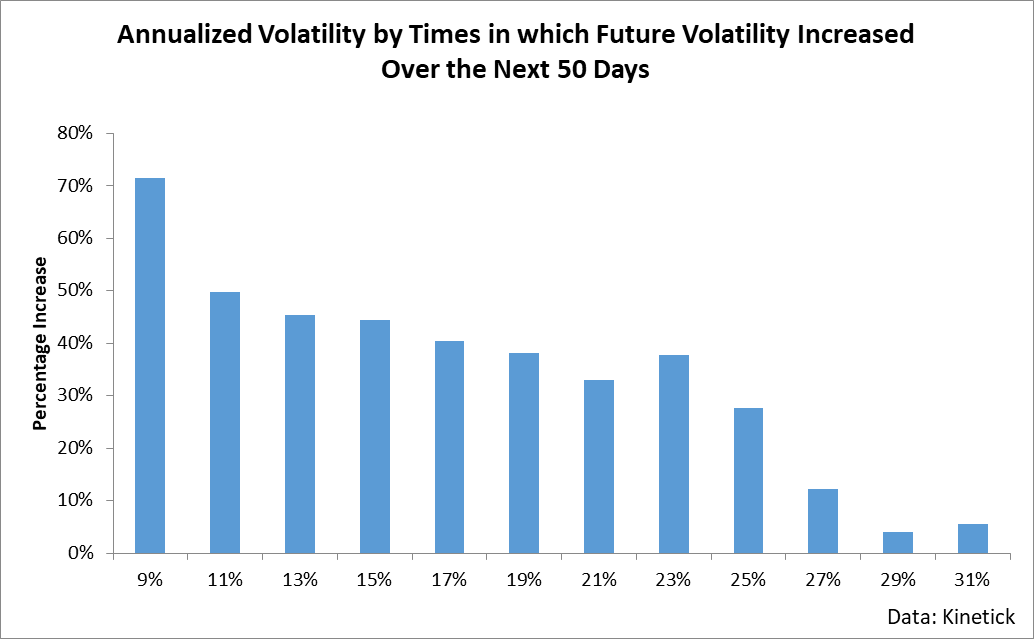
As you can see, there's a general tendency for lower volatility levels to be followed by higher volatility levels and for higher volatility levels to be followed by lower volatility levels.
At present, we have seen a surge in the VIX as well as a pop in short-term volatility of the S&P 500. These two largely track each other, but it is important to remember that VIX is actually a calculation off of the options market and not actually the annualized 30-day volatility of the S&P 500. In other words, options trades could potentially influence the VIX in unforeseeable ways that results in a departure from the intent of the index. It's an inescapable reality of trading these instruments, but in general the VIX will largely track macro movements in S&P 500 volatility.
When the VIX rises, which we have recently seen, it tends to fall in the immediate future (which we will likely see). For example, here are some simple studies of the VIX I just ran using the past five years of data.
- VIX is highly mean reverting. An up week in which the VIX rallied is followed by a down week roughly 69% of the time. In other words, since we just saw a VIX pop, we're likely to see a VIX drop.
- Large movements in the VIX are typically reversed. For example, last week saw the VIX rise by 5.45 points. In the past five years, there have only been 16 weeks which have seen the VIX rise by this much or more. Of these 16 weeks, only 3 (19%) were higher next week and zero (0%) were higher 3 weeks into the future. In other words, the bigger the pop, the greater than chances of a drop.
Putting these statistics together, we can fairly conclusively say that we are likely to see the VIX drop in the coming weeks. In fact, we can use this information to time our entries into SVXY by increasing our long positions following surges in the VIX. Based on this information and the favorably low prices in SVXY, I think now is a great time to buy the shares.
Disclosure: I/we have no positions in any stocks mentioned, and no plans to initiate any positions within the next 72 hours. I wrote this article myself, and it expresses my own opinions. I am not receiving compensation for it (other than from Seeking Alpha). I have no business relationship with any company whose stock is mentioned in this article.
