


When it comes to leveraged ETFs, two of the more popular myths are as follows:
"They all go to 0 over time."
"If you hold them for more than a few days, you will lose money."
Fact or fiction? You be the judge...
The 3x Long Nasdaq 100 ETF (NASDAQ:TQQQ) was launched in February 2010, over 8 years ago. Since its inception, it has advanced 4,357%, versus a gain of 378% for the unleveraged Nasdaq 100 ETF (NASDAQ:QQQ).
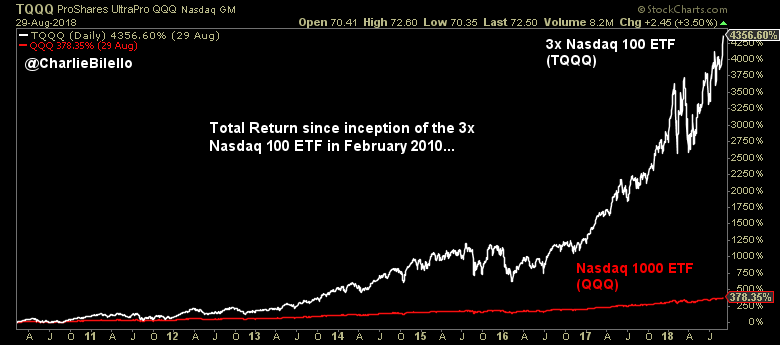
From this one chart, we can say two things:
- There is no natural form of decay from leverage over time (they don't "have to" go to 0).
- The idea that leverage is only suitable for short-term trading is a falsehood (you can certainly hold them for more than a few days and make money).
That's not to say that leverage is without risk - there is much risk in using 3x leverage - just that the source of that risk does not come from some inherent decay.
What does cause significant problems for constant leverage over time? Volatility.
Daily re-leveraging (to 2x, 3x, etc.) combined with high volatility creates compounding issues, often referred to as the "constant leverage trap." When the path of returns is not trending but alternating back and forth between positive and negative returns (seesawing action), the act of re-leveraging is mathematically destructive. The reason: you are increasing exposure (leveraging from a higher level) after a gain and decreasing exposure (leveraging from a lower level) after a loss, again and again.
The opposite of this harmful scenario is an environment that is friendly to leverage: uptrends with streaks in performance and low volatility.
As we illustrated in the paper "Leverage for the Long Run," these concepts are related. When the Nasdaq 100 is in an uptrend (e.g., above its 200-day moving average), it tends to have lower volatility and more streaks in performance (consecutive up days). These factors are helpful when using leverage.
It is no coincidence, then, to find out that since TQQQ launched in February 2010, QQQ has been in an uptrend 89.3% of the time. This is significantly higher than the long-term average of 71.3% going back to March 1999 (inception of the Nasdaq 100 ETF). In turn, its annualized volatility of 16.7% has been significantly lower than the longer-term average of 28.0%.
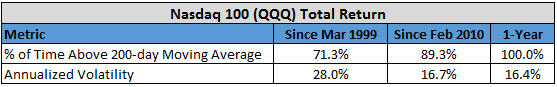
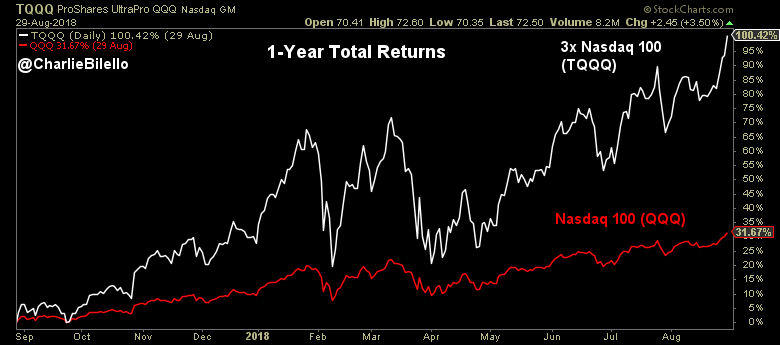
Over the past year, the Nasdaq 100 has been in an uptrend 100% of the time, with annualized volatility of 16.4%. It's no surprise, then, that TQQQ is faring well - up over 100%, versus a gain of 32% for the unleveraged QQQ.
So, what's the catch? Why doesn't everyone just buy and hold leveraged ETFs like TQQQ?
Well, for one thing, they can't stomach the volatility. This has been one of the lowest-volatility periods in market history, and TQQQ still has annualized volatility of over 49% since its inception.
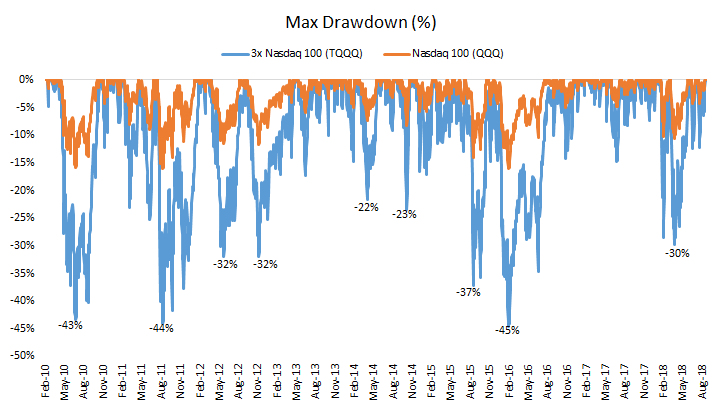
Volatility cuts both ways, and most investors would have a hard time sitting through the higher drawdowns that go hand-in-hand with increased leverage. Even in an extended period of tranquility for U.S. equities, drawdowns for the 3x leveraged Nasdaq 100 have been considerable (a maximum of 45% back in 2015-2016, with many 20+% declines).
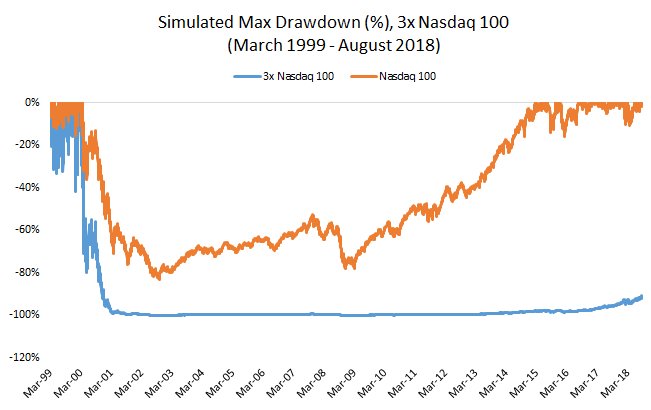
In an average bear market, investors can easily expect a drawdown in excess of 75% using 3x leverage. In a more severe bear market, the damage can be nearly impossible to come back from. Had the 3x leveraged Nasdaq 100 ETF been around in March 2000, it would have lost over 99.95% during the ensuing bear market that took the Nasdaq 100 down by more than 80% to its low in October 2002.
A 99.95% loss requires a gain of 200,000% just to break even. Needless to say, a 200,000% return doesn't happen overnight. At an 8% annual return, it would take almost 100 years of compounding to hit 200,000%. That assumes a straight line, which is not the way markets work. If there's another crippling bear market with high volatility in that 100-year period (a near certainty), this timeline could very well be extended for another century.
A visual of this concept may be more instructive. While after the 2000-02 bear market the Nasdaq 100 hit a new total return high in February 2015 (orange line in chart below), a hypothetical 3x leveraged exposure would still be 91% below its March 2000 high (blue line in chart below). The incredible rally since March 2009 is barely noticeable. That is the math behind of gains and losses, where the percentage gain required to make up for a loss increases exponentially as the loss approach 100%.
Still, given the right environment (uptrends with low volatility), investors can certainly buy and hold a 3x leveraged exposure for years on end and make tremendous gains. The past 9 years have been a testament to that fact. It is a myth to say otherwise.
The real problem with a 3x leveraged buy-and-hold strategy is that it magnifies the primary issue with unleveraged buy-and-hold: that it is hard to hold through large drawdowns. Many investors do not have the temperament to deal with a 20% decline, let alone 40%, 60%, 80% or 99.5%.
We haven't had to worry much about declines in recent years, but risk has not been eradicated. There is no free lunch in markets, and the use of leverage to amplify returns is no exception to this rule. Those tremendous gains experienced in recent years will be followed at some point by tremendous losses. If that fact sounds unappealing to you, now would be a good time to take a hard look at your portfolio and understand the risks you are taking.
$9,195 now $8,280
$23,120 now $22,080
=================
$32,315 now $30,360

If price oscillates around the SMA, commissions will be high and we will have a lot of overhead constantly tracking the SMA and placing new orders as the SMA changes.
Perhaps another way of asking my question is whether there is a brokerage that (1) allows orders to be placed as a function of a technical indicator like SMA and (2) has low commissions.
Is there a good indicator that would serve as a dampener to avoid high-frequency trading when the price is near SMA?
The SMA-crossing prices come in pairs, where each of the two prices in the pair are very similar. So there is not a lot of room for error in the strategy. Waiting until market close to trade likely means price has diverged from the SMA a little.
I've posted a similar comment to Van Domelen's article seekingalpha.com/...

Check out 5, 10, 15, and 20-period moving averages (or thereabouts) applied to TQQQ / SQQQ since Jan 2018.
Consider using a moving average strategy to [frequently] alternate between long and short on TQQQ's / SQQQ'S volatilized reversals.
This strategy could require paying a fair bit of commissions depending on the number of trades involved [but see *NOTE* below], and you may underperform buy-and-holding TQQQ, BUT even after commissions, you may still be able to substantially outperform SPY, with DRAMATICALLY reduced drawdowns compared to buying-and-holding TQQQ.
*NOTE* . Hey, those brokers are what make this game all possible in the first place. . Also, you may also wish to consider Firstrade as a broker for frequent-trade strategies -- Firstrade is a broker that has been in business since 1985, and has recently switched to $0 commissions on stocks and options.

https://tinyurl.com/yaasnndm
Providing the 'cash' achieves a return comparable to what the leveraged ETF pays to daily borrow in order to buy more stock, then the tracking will tend to be close. 33.3/66.7 (50/50) weightings can/will however drift and hence the need to periodically rebalance back to 33.3/66.7 (50/50) allocations.
Zvi Bodie likes to use 10x leverage via Traded Options, 90% safe, 10% 10x stock leverage to similar effect (that however would require monthly rebalancing in order to minimise drift).


That also offers good built-in ongoing quality vetting (SP500 stocks only) which makes fundamental sense over the long term.
Using long term charts to identify and follow trends is always more instructive than just investing one day and guessing what tomorrow will bring without actually "seeing" where the investment has already been and "looking at" where it is most likely to be heading.
If an architect tries to build luxury apartment buildings without knowing what a successful one looks like, he may well decide to put the penthouse on the first floor under the theory that it will be easier for the owner to get to. Photos and Charts cut through all the scary math and limitless theories and provide the views needed to show the complete past as well as likely future.... be it up, down or sideways. Look at the charts and go with the clear winners.... and let the others go to zero if they want to.
And if you want to own a successful and desirable penthouse, pick the building in the photos that shows that it being built up at the top.


I consider that potentially the perfect hedge: Not setting a stop-loss but always having a buy order in the system for say -25 and -40% or so. You may never buy, but IF you do during a flash crash or so you'll be very happy after a few days. Just an old idea that I haven't used in practice yet. But think about it as it costs you nothing having the order in the system.
drftr


I think I've asked a couple of months ago but never saw an answer, but did you ever publish a follow-up for Leverage For The Long Run? That was a most interesting read.
Tnx...
drftr


The question is: prohibitively more expensive?
I think the big boys are getting waaaaay better rates than we would.
drftr

But every once in a while, I am able to remind myself that holding even a fairly conservative amount through say, a 30% market correction, is not something that I want to do. And I’ve been around long enough to know that yes, a 30% correction, or more, is very possible.


drftr

do it. Averaging down on a quality ETF is one way to
keep the income coming in.

Hope things are well with you. Based on your back tests of your strategy( getting out based on sma) , when and how much was the worst drawdown and what was the drawdown and length of drawdown during the 2000-2002 bear market and 2007-2009 bear mkt.
I am leaning towards using the sso/ust ( 2x) approach to be a little conservative.
Before you leave, i would like to learn how one would generate synthetic data for these to back-test on PV. i don't think this would be the right approach as this link suggests due to tracking error isn't it( at least thats what many people say).
"daily returns for VFINX and VUSTX were multiplied by 3"
seekingalpha.com/...
Once you're there YOU let ME know what you find instead of the other way 'round as this creates a very good check of what you've done.
One thing: Having created your optimal multiplier this way is as good as it gets. You can never fully trust it, but you can't get better data, unless you use ^GSPC data from Yahoo. I would suggest doing that as a check of your multiplier though. If you want to see how accurate it is you can calculate it for, say, 2003-2010 and for 2011-2019 and see how big the difference is over the years if you apply these 2 (different for sure) numbers.
Hope this helps...
drftr
