


Over the past few weeks, the stock market has moved from an oversold extreme to an overbought extreme, a function of the violent December sell-off followed by the near-vertical rally.
On December 24, the S&P 500 closed at 2,351, down 14.8% on the month and 20% from its all-time high. Notably, the NYSE McCllellan Oscillator (a market breadth indicator) hit one of its lowest levels in the past 20 years: -109.61.
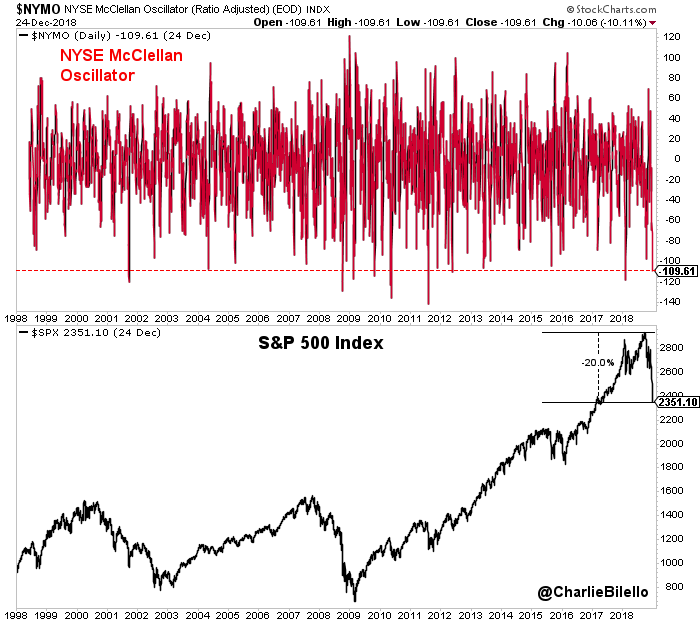
Note: Data on $NYMO (McClellan Oscillator) is from StockCharts.com and goes back to June 1998.
By all accounts, the market was extremely oversold. What happens when the market is extremely oversold?
It tends to bounce, with above-average forward returns over the next 12 months (+20.7% vs. +7.9% for all readings) and a higher probability of a positive return (up 87% of the time over next 12 months vs. 76% for all readings).
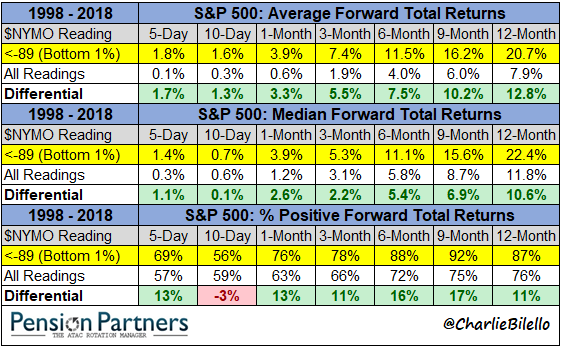
Note: Highlighted area in table represents the bottom 1% of all $NYMO readings, or the most short-term oversold data points going back to June 1998.
And bounce it did, with the S&P 500 rallying 10% in the next two weeks. What happened to the McCllellan Oscillator? It shifted 180 degrees, hitting its second highest level in the past 20 years on Jan 9: +117.76.
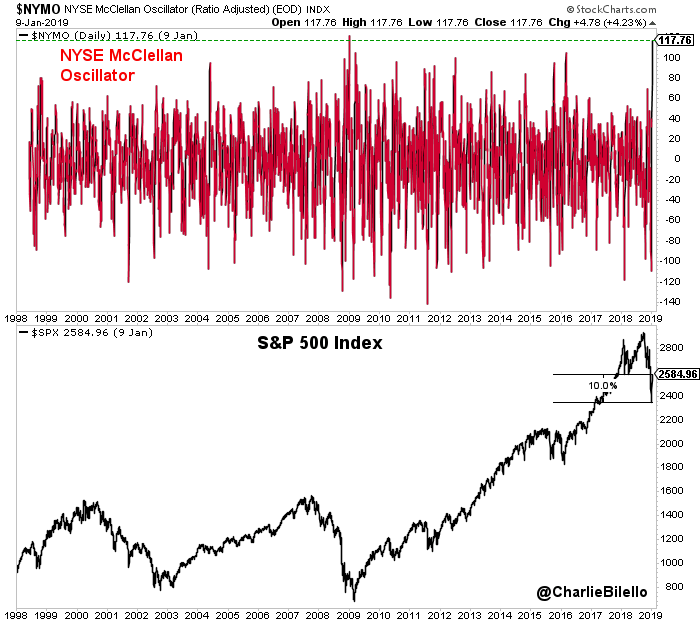
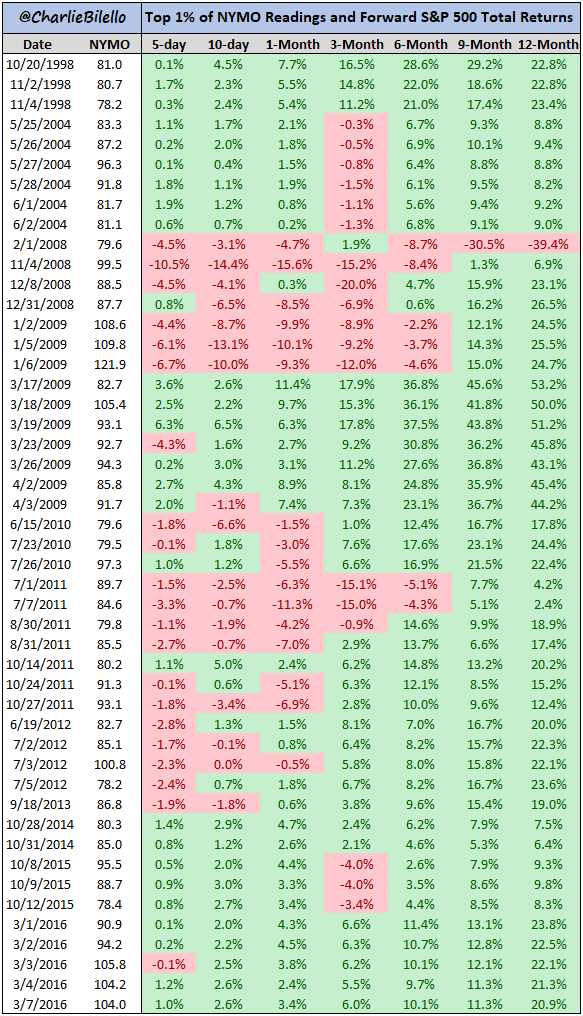
By all accounts, the market was now extremely overbought (on a short-term basis, at least). What happens when the market is extremely overbought?
It tends to continue to rally, with above-average returns over the next 12 months (+20% on average vs. +7.9% for all readings) and a higher probability of a positive return (up 98% of the time over the next 12 months vs. 76% for all readings).
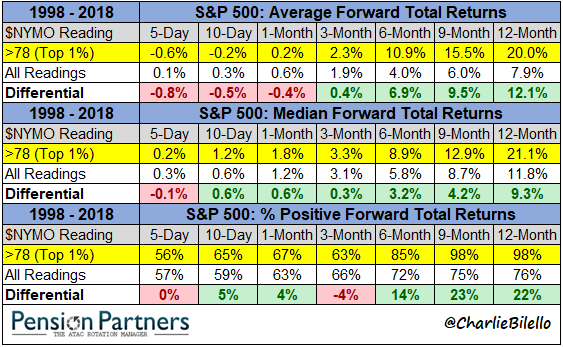
Note: Highlighted area in table represents the top 1% of all $NYMO readings, or the most short-term overbought data points going back to June 1998.
Are these results intuitive? Certainly not.
It is one of the great paradoxes in markets that both extreme oversold and extreme overbought conditions tend to be followed by above-average returns. How is this possible? Likely because extreme strength begets strength (momentum) while extreme weakness does the same (mean reversion). Momentum and Mean Reversion are the most powerful forces in markets, and they exist because investors overreact and underreact to new information, again and again.
What will happen from here? Nobody knows. The best we can say in markets is what is more or less likely to happen, and those odds are forever changing.
When the market has been this extremely overbought in the past, it has tended to continue its ascent with above-average performance. But alas, tends to is far from always. There are a number of examples where the market suffered nasty declines after extreme overbought readings (Feb/Nov/Dec 2008, Jan 2009, July 2011, etc.)…
These "exceptions" should come as no surprise, for there is no holy grail in markets. There are only probabilities, never certainties. Accepting that truth as a trader or investor goes a long way.
Editor's Note: The summary bullets for this article were chosen by Seeking Alpha editors.
