


This article doesn't make predictions. It is an objective view on hard data about SPY and the economy. We can see good, bad, and ugly things in the current situation.
The Good
AAII sentiment:
In this week's AAII survey, bullish and neutral opinions are almost in equal weight (35.4% and 35.9%). Bulls are 2.5 percentage points below the historical average. If bull markets die in euphoria, we are not yet there. In May, the bull ratio fell under 1 standard deviation below the mean. According to AAII historical data, it was a contrarian clue pointing to an 84% probability of gain in the next 12 months and a median return about 14%. Of course, past data are not a guarantee for the future.
Short interest in SPY components:
...we find that short interest, when aggregated across firms and appropriately detrended, is a statistically and economically significant predictor of future market excess returns.
(Short Interest and Aggregate Stock Returns - Rapach, Ringgenberg, Zhou - 2016)
The authors of this research show that the average short-interest in stocks is a good predictor of market return: the lower the value, the better the expectations. The average short interest in S&P 500 stocks is in a short-term uptrend and just hit a 12-month high:
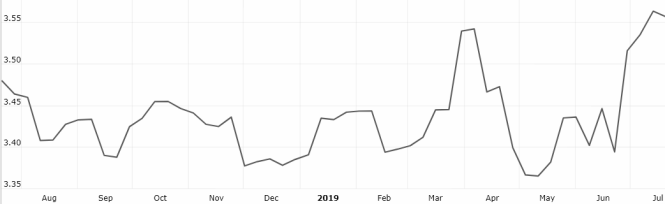
12-month chart of the average short interest in S&P 500 stocks, in percentage points
However, it is still low from a historical perspective:
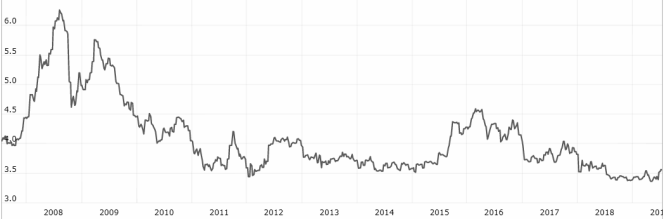
12-year chart of the average short interest in S&P 500 stocks, in percentage points
Unemployment:
Looking at unemployment rate on 70 years, I found its short-term trend may be one of the best market timing indicators among simple economic data. The unemployment rate is 3.7%, just above its lowest value since August 1969 reached in April and May. It still looks good for now:
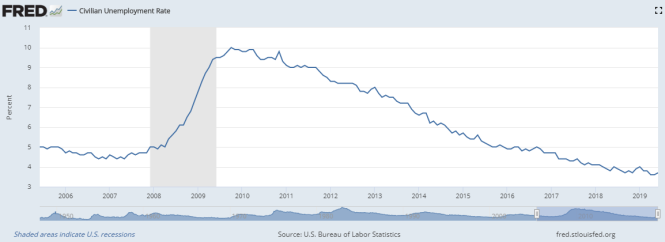
U.S. Bureau of Labor Statistics, Civilian Unemployment Rate [UNRATE], retrieved from FRED, Federal Reserve Bank of St. Louis.
Real Retail and Food Sales:
Retail and Food sales have stayed in a range from December to April, but the reading for June published on 7/16 is an all-time high:
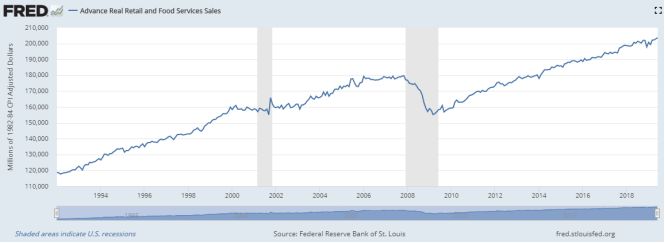
Federal Reserve Bank of St. Louis, Advance Real Retail and Food Services Sales [RRSFS], retrieved from FRED, Federal Reserve Bank of St. Louis.
Earnings of SPY components:
In the previous earnings season (Q1 reporting), more than 99% of S&P 500 companies have published full earnings data. 74% of them has beaten EPS expectations. It is better than 68% for 2018 Q4 reports, but a bit down from 80% in 2018 Q2. The best sector in this regard is communication (88% beats), and the worst one is Utilities (50%).
For Q2 reporting, only 15% of S&P 500 companies have published full earnings data when I write this, with 75% of them beating EPS expectations.
The S&P 500 aggregate operating margin for Q1 was 11.21%, more than 1 percentage point above 2018 Q4, and about 1 pp below the all-time high of 2018 Q2.
The S&P 500 aggregate EPS for the trailing 12 months and projected for 2019 is stable since February and still in a bullish trend:
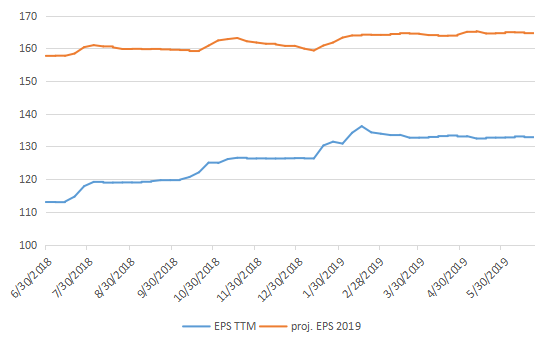
Aggregate EPS of SPY components
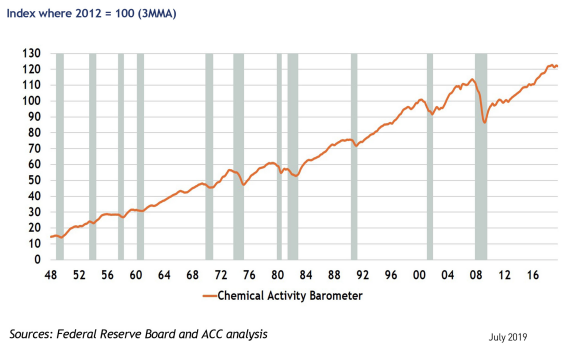
CAB:
The Chemical Activity Barometer (C.A.B.) is a leading indicator based on chemical activity published by the American Chemistry Council. It has been in a range since October 2018. My indicator based on it is still slightly bullish for now.
Baltic Dry Index:
The Baltic Dry Index (hereafter named BDI) is a weighted average of bulk shipping freight costs on several routes. Bulk shipping is in the early steps of the supply chain of many products, making BDI a potential leading indicator of global economic activity. It is very volatile due to a variable demand and an inelastic offer. It is so expensive to maintain a large ship idle in a harbor that it's cheaper to keep it navigating at a low freight cost. Therefore, a small variation in raw materials shipping can result in a large variation in BDI. Academic research reports that BDI shows a correlation with returns in some commodities and stock markets.
...predictive regressions of stock market returns on the BDI growth rate are overwhelmingly positive and statistically significant.
(The Baltic Dry Index as a Predictor of Global Stock Returns. Bakshi, Panayotov, Skoulakis, 2011)
3-year chart of the Baltic Dry Index by "investing.com":
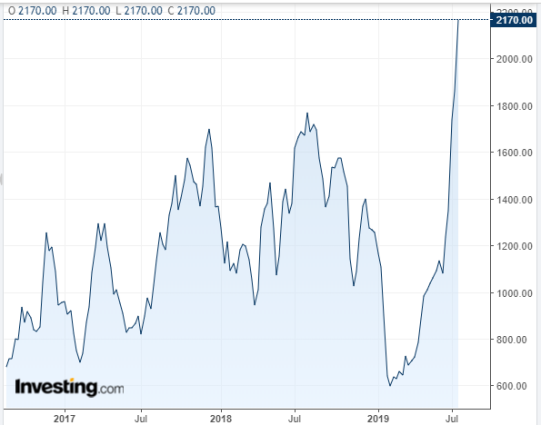
BDI is at a multi-year high, and my indicator based on it has been bullish for a few months.
The Bad
Valuation:
S&P 500 stocks were overpriced by about 28% at the end of June based on my metrics. It's bad, but it was worse in October 2017 when I measured an overvaluation of 32%, and SPY was significantly lower. Despite high valuations, my simplified equity premium model was favorable to stocks at the beginning of July.
Housing Starts:
Housing starts stand in a horizontal range for 3 years. In 2018, they broke a bullish trend line initiated in 2011.
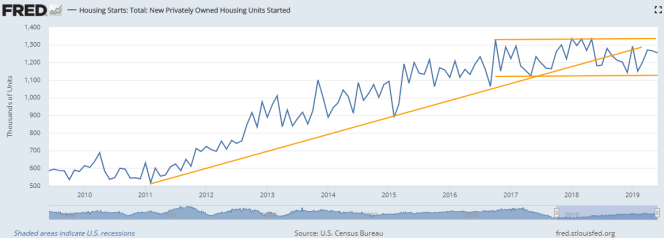
U.S. Census Bureau and U.S. Department of Housing and Urban Development, Housing Starts: Total: New Privately Owned Housing Units Started [HOUST], retrieved from FRED, Federal Reserve Bank of St. Louis.
The last 2 readings are in the upper half of this range, but still under the trend line. In summary, housing starts have been swinging between bullish and bearish for 3 years.
The Ugly
Treasury yield spread:
The 10-year minus 3-month Treasury yield spread was marginally negative from 3/22 to 3/28/2019 for the 1st time since 2007, then again on 5/15 and since 5/23.
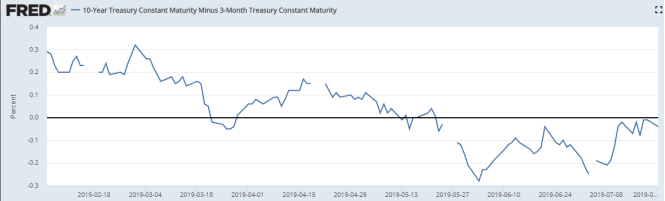
Spread T10Y3M retrieved from FRED, Federal Reserve Bank of St. Louis.
A negative value has anticipated previous recessions by 6 to 18 months. However, the data sample is too small to evaluate its statistical accuracy, and previous signals had much larger negative spread moves. It looks a possible recession predictor but a bad timer.
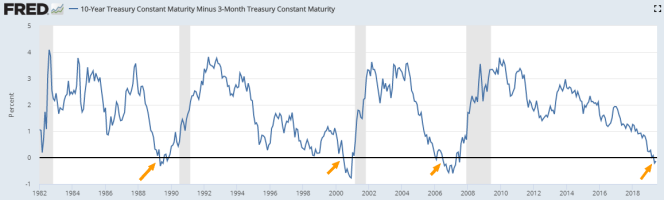
In the chart above, grey zones are recessions according to the NBER (indicator USREC in St Louis Fed online database).
Some of the data presented above are components of the systemic risk indicator MTS10 and the leading indicator SLI. MTS10 and SLI are parts of Quantitative Risk and Value, along with ETF strategies, hedging tactics, and backtested stock lists selected on quantitative value in all sectors. I sometimes publish partial updates like this one in free-access articles. However, timely updates are posted in private. Get started with a two-week free trial and see how QRV can improve your investing decisions.
Disclosure: I am/we are long SPY. I wrote this article myself, and it expresses my own opinions. I am not receiving compensation for it (other than from Seeking Alpha). I have no business relationship with any company whose stock is mentioned in this article.
