股市小书生
价值投资


T. Rowe Price Group Remains Strong In The Long Run - 这是大千网友BIGCATWX写的分析文章。
Summary
- Based on a SWOT analysis, despite the macroeconomic headwinds, T. Rowe Price Group has increased strength and diversified capabilities once the cycle shifts.
- TROW has low dividend payout ratio and strong annual dividend growth rate. With its current dividend yield at 2.5%, there is huge potential ahead.
- The current relatively low market price is not a performance issue. It's a macroeconomic issue. I have confidence in the stock in the long run.
T. Rowe Price Group (NASDAQ:TROW) has been quite popular in the Dividend Growth blogosphere. Dividend Dreams, DivGro, Dividend Mantra, and Harvesting Dividends all bought shares in the lower $80s range and benefited from the recent announcement of special $2/share dividends. This aroused my interest in this company, and I did my due diligence on the analysis.
Company Overview
T. Rowe Price Group is the investment adviser to the T. Rowe Price family of no-load mutual funds, and is one of the largest publicly held U.S. mutual fund complexes.
It offers mutual funds and separate accounts that employ a broad range of investment styles, including growth, value, sector-focused, tax-efficient, and quantitative index-oriented approaches.
At year-end 2014, TROW had a record $746.8 billion of assets under management, with 78% invested in stock and blended asset portfolios, and 22% in bond and money market portfolios.
TROW SWOT Analysis
(click to enlarge)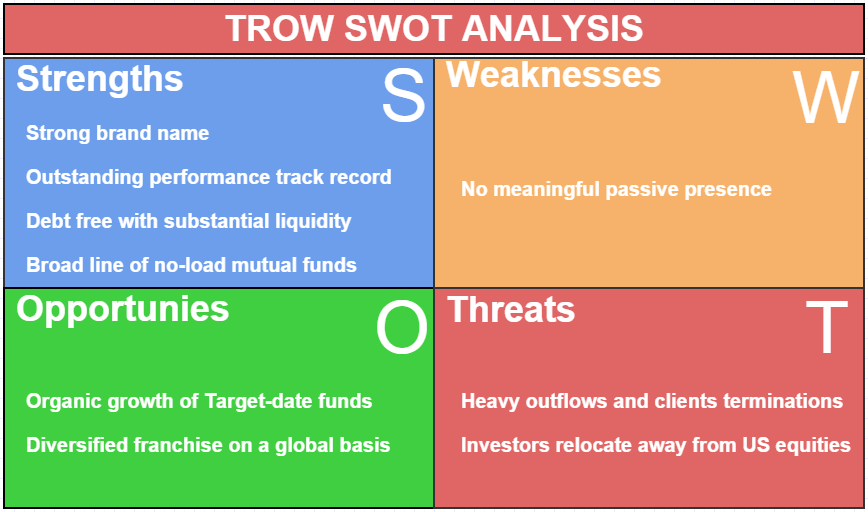
I did a SWOT analysis for T. Rowe Price Group. The purpose of this analysis is to evaluate the strengths, weaknesses, opportunities, and threats involved in this potential stock purchase candidate. There are other broad market challenges and opportunities, such as rising dollar, falling oil prices, and central bank actions to stimulate economic growth pose opportunities as well as challenges as to the varying reform efforts around the globe. I didn't consider these factors in the SWOT analysis, but focused on the factors that directly affected the firm's performance.
Strengths
T. Rowe Price Group operates one of the largest no-load mutual fund and life cycle fund complexes in the United States, with December 31 AUM of nearly $747 billion. It is one of the strongest brands in the industry.
TROW has an outstanding performance track record. For the three-year period ended March 31, 2015, 75% of the T. Rowe Price mutual funds across their share classes outperformed their comparable Lipper averages on a total return basis, 79% outperformed for the five-year period, 88% outperformed for the 10-year period, and 78% outperformed for the one-year period. In addition, T. Rowe Price stock, bond, and blended asset funds that ended the quarter with an overall rating of four or five stars from Morningstar account for 83% of the assets under management in the firm's rated funds. The performance of the firm's institutional strategies against their benchmarks was substantially similar.
T. Rowe Price Group remains debt-free, with ample liquidity, including cash and sponsored portfolio investment holdings of nearly $3.7 billion as of March 31, 2015. Although TROW suffers heavy outflows, it remains strong on earnings and revenue results. The company attributes the increased profitability to investing corporate cash in its own funds.
T. Rowe Price's broad line of no-load mutual funds makes it easy for investors to reallocate assets among funds (which is not the case at some smaller fund companies), contributing to increased client retention.
Opportunities, Weaknesses, and Threats
T. Rowe Price Group Inc. has seen heavy outflows and client terminations during the past two years from asset owners reducing their U.S. equity exposure and/or seeking passive strategies.
A lot of large institutions want to use passive for an increasing amount of their equity exposure. And T. Rowe doesn't have a meaningful passive presence.
TROW's target-date franchise has been a great way of weathering these headwinds. Organic growth of T. Rowe's target-date funds significantly outpaced that of the industry as a whole for the year ended December 31. Its organic growth rate exceeded 13% for 2014, while the industry's was less than 10%. The firm's target-date retirement funds continue to deliver very attractive long-term performance, with 100% of these funds outperforming their comparable Lipper averages on a total return basis for the three- and five-year periods ended March 31, 2015.
TROW continues to expand globally. International clients account for about 7% of assets under management; this is an area that the company is focused on growing. The company subadvises investment assets for Daiwa SB Investments in Japan, in which TROW holds a 10% interest. Also, in early 2010, the company completed the purchase of a 26% equity interest in the Indian firm UTI Asset Management Company and an affiliate.
As usual, I'll use my stock purchase criteria as the basis for stock analysis.
TROW Stock Purchase Criteria
(click to enlarge)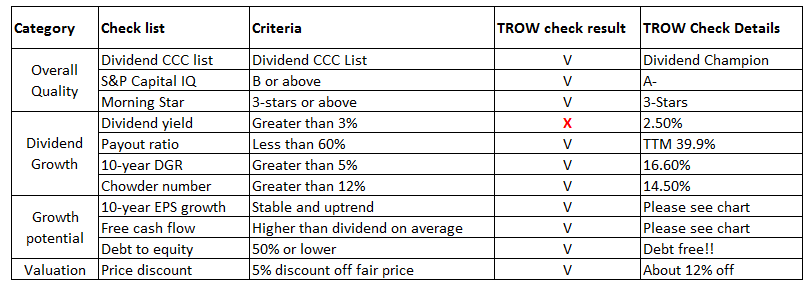
In my total 11 check lists, TROW meets 10 of them, only with the exception of the current dividend yield.
The company's overall quality, according to my criteria, is quite favorable. This stock is one of David Fish's dividend champions, with 29 consecutive years of higher dividends. S&P Capital IQ quality ranking is an "A-", and analysts' risk assessment is a "MEDIUM". Morningstar offers it a positive 3-star rating.
Dividend Growth
TROW's current dividend yield is 2.5%, based on its current market price of $82.40 - lower than my 3% threshold. However, I am not too concerned about the company considering its current low payout ratio at around 40% (TTM), which implies a lot of potential for future dividend growth.
TROW's 10-year dividend growth rate (DGR) is 16.60%, its 5-year is DGR 12%, the 3-year is 12.4%, and its 1-year DGR is 15.8%. Based on these data and its low payout ratio, it is quite reasonable to assume that TROW will be able to maintain annual DGR above 10% in the next few years. If the company continues to keep annual DGR at 12%, it'll take around 12 years to achieve 10% annual return, solely on a dividend basis.
- 1-year DGR 15.8%
- 3-year DGR 12.4%
- 5-year DGR 12%
- 10-year DGR 16.6%
(click to enlarge)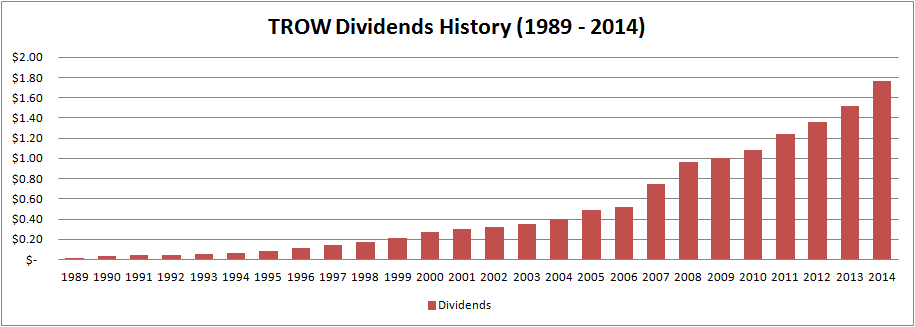
(Data summarized from Yahoo Finance)
TROW Growth Potential
I focus on three indicators to examine companies' growth potential: earnings per share (EPS), free cash flow (FCF), and debt-to-equity. Earnings per share serves as an indicator of a company's profitability. Its importance is needless to say. Free cash flow represents the cash that a company is able to generate after laying out the money required to maintain or expand its asset base. FCF is important because it allows a company to pursue opportunities that enhance shareholder value. Without cash, it's tough to develop new products, make acquisitions, pay dividends, and reduce debt.
TROW's EPS growth is healthy and stable, well above its dividend payments. Its FCF remains impressively positive and strong.
- 10-year EPS average $2.66, annual growth rate average 14%
- 10-year FCF average $2.69, annual growth rate average 13%
- 10-year dividend average $1.08, annual growth rate average 16%
(click to enlarge)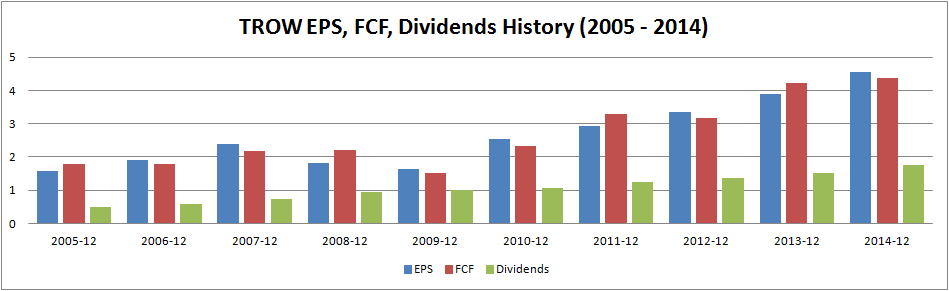
(Data summarized from Morningstar)
The debt-to-equity ratio measures a company's financial leverage calculated by dividing its long-term liabilities by stockholders' equity. T. Rowe Price remains debt-free, with substantial liquidity and resources that allow the company to take advantage of attractive growth opportunities and invest in key capabilities, including investment professionals, technologies, and new fund offerings.
TROW Valuation
Due to the market challenges and industry cyclicality, TROW does not match the performance of the market in the recent 5 years. Its total price appreciation is 39.95% versus SPY's 77.09%.
(click to enlarge)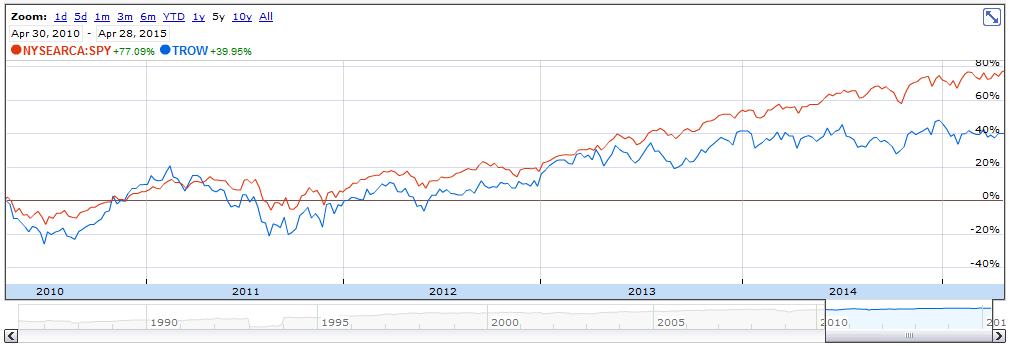
(Data from Google Finance)
TROW's current P/E ratio is the lowest in 10 years, although its annual EPS keeps a strong and positive trend. S&P's Oper. EPS 2015E is $4.92. Based on this EPS estimate and its current market price, the company's P/E ratio is only 16.80.
(click to enlarge)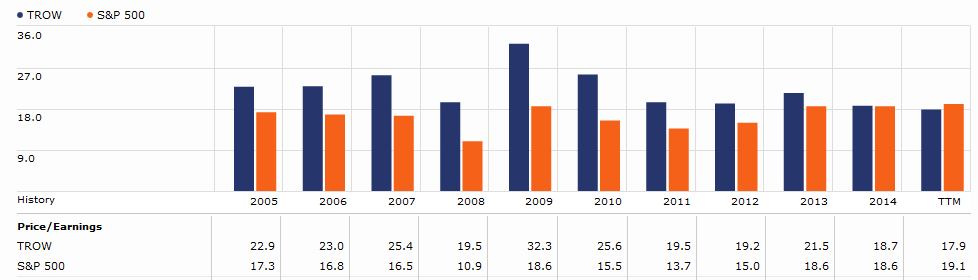
(Data from Morningstar)
Based on all above analysis, I agree with Mr. Ken Moreland, chief financial officer, who said, "Where we've seen outflows over the last 18 months have been in strategies that have been outperforming their benchmarks. It's not a performance issue. It's a macroeconomic issue." So in the long run, I have confidence in the company.
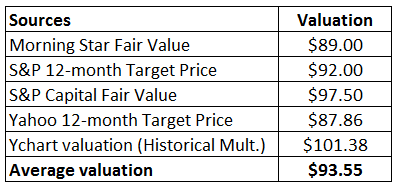
Experts offer a range of fair value estimation from $87 to $101, with an average valuation at $93.55. The current price of $82.40 is around a 12% discount off its fair value average.
I set a target entry price at $78, and will buy shares if the market price falls back to the upper $70s.
Franklin Resources: Gain From Its Capital Allocation Strategy
Summary
- Franklin Resources has not only paid but also increased its dividend for over three decades.
- However, the security often escapes the typical dividend investor due to its low starting yield.
- This article looks at the three shareholder reward avenues, which differ slightly from your typical dividend growth company.
Often when you think about the investment management business, you think about reducing your fees. We've all seen the demonstrations where even a seemingly small difference, say 1% annual fees versus 0.5% or 0.1%, can have a dramatic influence on returns. As such, investors have learned to seek out a low cost option - in whatever form that may be.
Yet there could be an even better scenario: not paying fees and benefiting from others who do pay fees. It's sort of like a negative fee if you think about it, or at the very least sitting on the other side of the table. In order to achieve this, you can invest (become an owner) in an investment management company.
While there are many options available, today I'd like to focus on Franklin Resources (NYSE:BEN). The company has not only paid but also increased its dividend for 35 consecutive years. Yet despite this impressive streak, I would suggest that the company doesn't get that much attention in the dividend crowd. And the reasoning is relatively straightforward: if you happen upon the ticker, the quoted yield - sitting around 1% or thereabouts - doesn't appear especially compelling. I agree. However, it does make you wonder how the company might be allocating its resources.
Let's start with the dividend. Here's a look at the split-adjusted dividend per share for the last decade:
|
Year |
Ordinary Div |
|
2005 |
$0.13 |
|
2006 |
$0.16 |
|
2007 |
$0.20 |
|
2008 |
$0.27 |
|
2009 |
$0.28 |
|
2010 |
$0.29 |
|
2011 |
$0.33 |
|
2012 |
$0.36 |
|
2013 |
$0.39 |
|
2014 |
$0.48 |
|
2015 |
$0.60 |
Note that the company's fiscal year ends September 30th and only two of the 2015 dividends, announced at $0.15 per quarter, have been paid thus far. The dividend growth rate over this time period has been quite robust. However, the beginning yield started at just 0.5% or so, and today the mark isn't much above 1%. As such, your lack of enthusiasm might remain. After all, it's easy to grow your dividend quickly if you begin with a rather low payout ratio. Yet I would contend that this is only a third of the story.
In addition to ordinary dividends, Franklin Resources has also shown a penchant for paying special dividends. Here's a look at both ordinary dividends declared quarterly and special dividends announced irregularly.
|
Year |
Ordinary Div |
Special Div |
|
2005 |
$0.13 |
$0.67 |
|
2006 |
$0.16 |
|
|
2007 |
$0.20 |
|
|
2008 |
$0.27 |
|
|
2009 |
$0.28 |
|
|
2010 |
$0.29 |
$1.00 |
|
2011 |
$0.33 |
|
|
2012 |
$0.36 |
$0.67 |
|
2013 |
$0.39 |
$1.00 |
|
2014 |
$0.48 |
|
|
2015 |
$0.60 |
$0.50 |
This is a much clearer picture of the company's dividend policy. The ordinary dividend remains as a low payout, quickly growing benefit. Sans the quickly growing part, it's sort of like an ongoing salary that represents a smaller portion of profits. From there, if the company does well, it rewards its owners with a bonus - in this case a special dividend. Here's the important thing to note: over the past decade, the ordinary dividend has accumulated to $3.50 per share or so. On the other hand, the company has paid out over $3.80 per share in special dividends. So although the special dividend happens intermittently, it nonetheless provides just as much - in this case more - of the total dividend return.
This is something that stock charts certainly won't tell you. Most won't even make adjustments for regular dividends, much less special ones received along the way.
If we were to just look at the dividends paid - both regular and special - the payout ratio over the years would routinely be in the 10% to 50% range with an average of about a third of earnings. So even though we've uncovered a second layer of return, we're still only looking at two legs. A third component comes in the form of share repurchases. Here's a look at total earnings, dividends and share repurchases over the years:
|
Year |
Earnings |
Dividends |
Special |
Repurchases |
|
2005 |
$1,058 |
$97 |
$502 |
$170 |
|
2006 |
$1,268 |
$118 |
$0 |
$986 |
|
2007 |
$1,772 |
$142 |
$0 |
$1,289 |
|
2008 |
$1,588 |
$179 |
$0 |
$1,543 |
|
2009 |
$897 |
$193 |
$0 |
$377 |
|
2010 |
$1,446 |
$199 |
$685 |
$676 |
|
2011 |
$1,924 |
$216 |
$0 |
$954 |
|
2012 |
$1,931 |
$251 |
$412 |
$798 |
|
2013 |
$2,150 |
$248 |
$635 |
$491 |
|
2014 |
$2,384 |
$290 |
$0 |
$622 |
Above we can see an interesting story being told. Over the past decade, Franklin Resources has used about $12 billion towards the endeavor of "returning value to shareholders." Yet it hasn't done so in your typical 50-60% dividend payout sort of way. With cumulative earnings of just over $16 billion during this time period, the company has been returning about 75% of its profits - which is on par with a typical well-established company. It's just done so in a slightly different way. Ordinary dividends, on average, represented just 12% of earnings, special dividends made up about 14% of earnings and share repurchases accounted for nearly half of earnings. (The latter of which eliminated one of every five common shareholders during the last decade.)
In structuring its capital allocation policy this way, the company has allowed itself a great deal of flexibility. Ordinary dividends are seen as very sticky - a freeze or a cut is greatly disdained. Alternatively, special dividends and repurchases are whimsical in nature. That is, much fewer people are going to complain about the lack of a special dividend this year, or seeing total share repurchases fall by a couple hundred million. Even though the effect of either event could very well be greater, the focus is first on ordinary dividends. In which case, the company has an exceptional capacity to not only keep paying its ordinary dividend but also continue increasing it.
Moving forward, I would expect more of the same. Specifically, a well-covered ordinary dividend that increases through time, sporadic special dividends and a strong emphasis on share repurchases. In structuring the company this way, management has a great deal of flexibility. The total capital returned might be the same as your typical well-established company, but the way in which investors benefit is going to be a bit more lumpy. If you're looking for a high and regular income, this probably isn't the security for you. On the other hand, if you're looking for a solid company with a prudent capital allocation strategy - rewarding investors in good times or bad - this very well could be the type of company that warrants more of your attention.

