子卓轩
人生如一盘棋局,琢磨着继续着,具有洞察力,和一颗平和宽容的心。尽了力就可以了,没有绝对的输赢


Thanks for all the great column topic ideas (and keep them coming). The ones we've gotten so far have all been outstanding, and we're looking forward to working through all the suggestions. With that, today we'll address one of the more common requests we've gotten. This particular question came worded many ways, but in essence, it sounds like many of you are looking for the perfect technical indicator. Believe me, I wish there was one. Unfortunately, it just doesn't work that way. If there was one sure-fire trading system, it would have been discovered a long time ago. The only advice I have for those seeking the proverbial holy grail is to give up that search. Instead, focus your time and energy on understanding the most important lesson in technical analysis and systematic trading.
So what's the most important lesson in technical analysis? For the time being, let's just forget fundamental analysis and news-driven market movement. What I'm talking about today is just pure chart-watching. The most important lesson in technical trading is that there are two basic kinds of markets. The first type of market is a trending market. The second type is a range-bound market. Knowing which type of market you're in at any given time is the secret to successful trading. Why? Because the type of market you're in dictates the type of indicator you use.
Now that we know there are two kinds of markets, let's explore the two basic types of indicators. There are oscillators, and there are momentum indicators. Oscillators are reversal oriented. They are designed to spot points in time when a market is overbought or oversold, and due for a reversal. In other words, they indicate points in time when a market move has probably exhausted itself and is ready to turn the other way. Trend indicators, on the other hand, seek to spot momentum, and are continuation-oriented. Their assumption is that a strong trend will continue, and you should trade with the trend. Have you spotted the disparity already? A trend will either continue, or it will reverse - but it can't do both! By default, when one type of indicator works, the other one will not.
Oscillators are great tools in a range-trading environment, characterized by short-lived swings (sometimes on the order of days) and quick reversals. Which oscillators have we used with success? Stochastics, Wilder's Relative Strength Index (not the 'relative strength' indicator), and Wilder's parabolic SAR. The chart below will graphically show how the stochastics indicator has worked well in a range-trading market. Each time we become stochastically overbought, the NASDAQ went lower. Each time we the composite became stochastically oversold, we bounced higher. The accuracy of the stochastic overbought/oversold signals was uncanny.
NASDAQ COMPOSITE WITH STOCHASTICS OSCILLATOR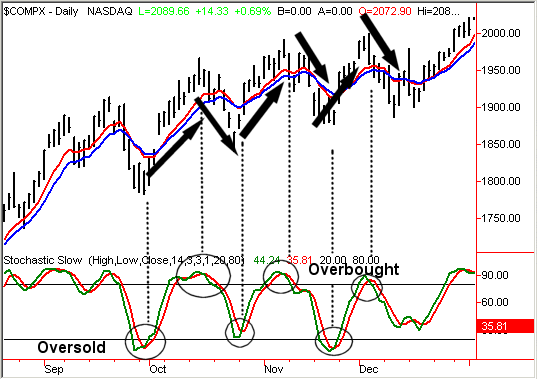
Tools such as moving average convergence divergence (MACD), ADX/DMI, and moving average crossovers are more apt to give good signals in a trending (momentum) environment, such as the middle of 2002 (to learn more about these momentum indicators, click here). However, these trend tools are somewhat ineffective in a range-trading environment. Circling the MACD crssovers on our NASDAQ chart below, you can see how helpful they were as buy signals. The timeframe for this NASDAQ chart was just before the time period we used on our stochastics chart above.
NASDAQ COMPOSITE WITH MACD (MOMENTUM) INDICATOR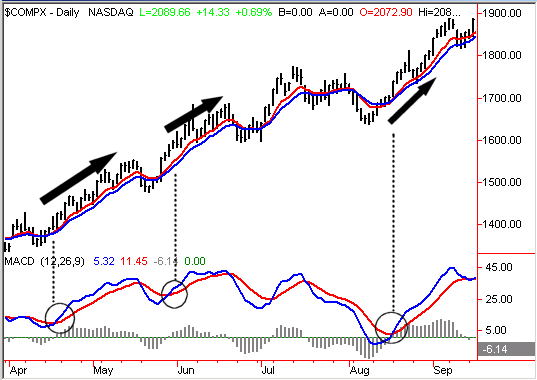
But what would happen if you tried to use an oscillator at the same time as a momentum indicator? Let's squeeze in both of the time periods we used from our charts above and put them in our last chart. As you can see below, you'd get a frustrating number of mixed signals. As such, it's very difficult (maybe near impossible) to simultaneously apply both types of tools. You'd have to be using one or the other. Obviously knowing which one to use would be very helpful.
NASDAQ WITH STOCHASTICS AND MACD MOMENTUM INDICATORS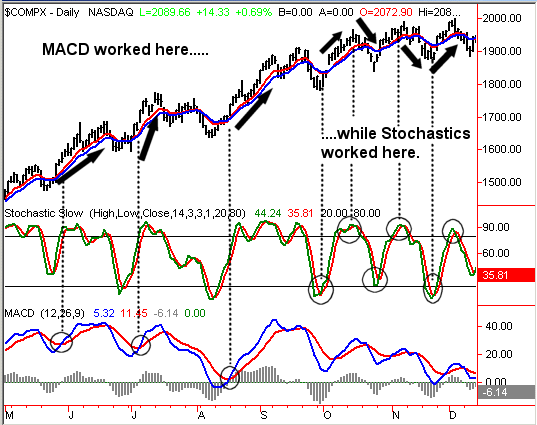
By now you're wondering how you're supposed to know which indicator to use at any given time. As I said earlier, there is no holy grail, but this tip comes pretty close to being one - you have to watch price charts as well as indicators. The movement of price bars will tell you what indicator to use. If you see an index moving back and forth in a narrow range, use an oscillator. If you see a stock moving an a straight line and breaking above or below previous highs or lows, that's a trend that should be spotted by a momentum indicator. Now, I'm not advocating a constant waffling between two indicators - there has to be some discipline. As a rule of thumb, when one indicator fails, switch back to the other one. When that one fails, go back to the previous one. Won't that indicator failure lead to a losing trade? Absolutely, but it's better to lose on one trade than it is to continue applying the wrong tool and end up losing on several trades in a row. Use the right tool at the right time, and you'll have an enormous amount of success. As always, the more you apply this concept, the better you'll become at using it.
Price Headley is the founder and chief analyst of BigTrends.com.
