LOL's Trading room
stay cool, play cool, you will be really cool
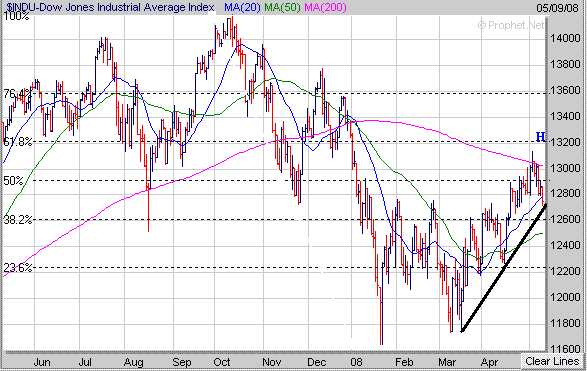
The Nasdaq has only fallen 70 points since last Friday's high and still remains above its 20 Day Moving Average (blue line) and newly developed upward sloping trend line (black line) from the mid March low. If the Nasdaq holds support at or above its 20 Day Moving Average early next week and rallies I expect it will eventually rally up to the 2510-2520 area which corresponds to its 50% Retracenment Level (calculated from the October high to the March low) and 200 Day Moving Average (purple line). Meanwhile if the Nasdaq breaks below its 20 Day Moving Average then look for a drop back to its upward sloping trend line near 2380.
The S&P 500 has fallen just under 40 points from last Friday's high and is now near a critical short term support level near 1385. The 1385 level corresponds to its 20 Day Moving Average (blue line) and is also along its newly developed upward sloping trend line (black line) from the mid March low. If the S&P 500 can hold support near the 1385 level early next week then we may see a rally develop with a potential rise up to its 200 Day Moving Average (purple line) around 1430. Meanwhile if the S&P 500 breaks solidly below the 1385 level next week then look for a drop back to its 50 day Moving Average (green line) near 1355.


