LOL's Trading room
stay cool, play cool, you will be really coolWeekend Stock Market Analysis
(12/16/06)
So far through the first two weeks of December the major averages have held up well with the Dow, Nasdaq and S&P 500 making new 52 week highs. As you may or may not know the month of December has historically been a favorable month for the market as since 1920 the Dow has had a positive return 74% of the time.
Meanwhile we are now approaching Christmas and I have done some additional research on market performance during the Christmas Holiday period going back to 1920 involving only those years that were a Mid Term Election Year. I looked at a three week window that included the week prior to Christmas Week, Christmas Week and the week after Christmas Week. The combined return for all three weeks is shown in the table below for the Dow going back to 1920 that was a Mid Term Election Year.
As you can see there have been 21 Mid Term Election Years since 1920 with only two of those years (1926 and 1990) having a negative return for the 3 Week Period near Christmas. Furthermore the Average Return for the Dow during the 3 Week Period was +2.45%. Thus based on these statistics the next 3 weeks have a strong bias towards the Bulls especially since it's a Mid Term Election Year.
Dow 3 Week Performance during Mid Term Election Years
(Week before Christmas Week + Christmas Week + Week after Christmas Week)
| 1922 | 0.92% | 1950 | 7.05% | 1978 | 3.15% |
| 1926 | -3.26% | 1954 | 3.63% | 1982 | 6.28% |
| 1930 | 0.89% | 1958 | 4.45% | 1986 | 0.79% |
| 1934 | 3.96% | 1962 | 2.17% | 1990 | -1.03% |
| 1938 | 1.34% | 1966 | 0.26% | 1994 | 1.58% |
| 1942 | 3.19% | 1970 | 1.57% | 1998 | 4.06% |
| 1946 | 1.69% | 1974 | 6.94% | 2002 | 2.07% |
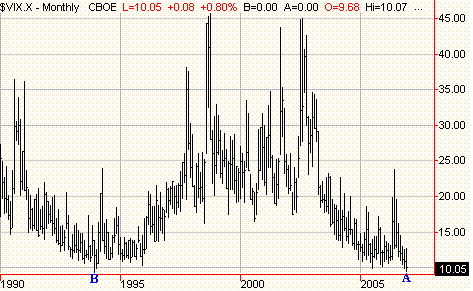
Meanwhile this past week the Volatility Index (VIX) dropped to 9.39 (point A) which is the 2nd lowest reading on record for the VIX since it started in 1986. The all time low for the VIX occurred on December 22, 1993 when it fell to a reading of 9.31 (point B). This is a significant development and means investors have become extremely complacent which could eventually spell trouble in the longer term but not necessarily in the near term.
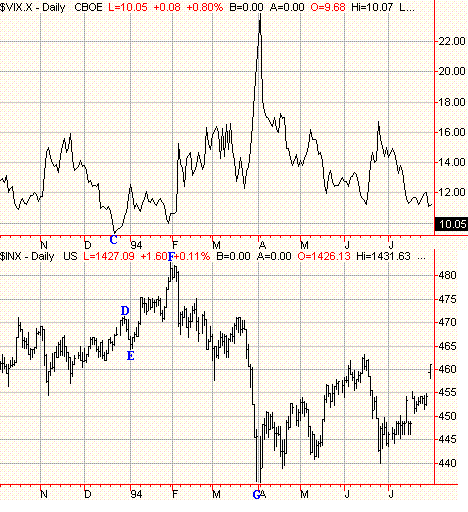
Next let's look to see what happened from late 1993 into 1994 as the VIX dropped to its all time low much like occurred this past week. As you can see below as the VIX reached its all time low at 9.31 (point C) this was followed by a brief 3 day correction in the S&P 500 the week after Christmas (points D to E). Meanwhile after this brief correction the S&P 500 then rallied strongly in January of 1994 (points E to F). However the S&P 500 then peaked in late January which was then followed by a substantial sell off from February through March of 1994 (points F to G) in which the S&P 500 dropped around 10%.
Thus if we see a similar pattern develop over the next few weeks then there could be a brief correction either next week or the week after followed by a nice rally as we move into January. However keep in mind that once January is over with we could see a substantial correction occur in the February to March timeframe.


