茅十八
cat18的博客 只为保留个人存在的记录


There is an old saying that nobody rings a bell at the top of bull markets. Traders are also advised to not try and catch a falling knife. It is nearly impossible to correctly time major market reversals, but those reversals often set-up tradeable chart patterns. One such pattern is the Parabolic Arc.
As equity markets continued to set new highs, many began to exhibit Parabolic Arc Chart Patterns. Once they started to fall from their peaks due to the Coronavirus, these Parabolic Arc patterns began to create sell signals. Here we describe how Parabolic Arc patterns work and how they are traded.
Parabolic Arc Patterns
Parabolic Arc chart patterns form following a steep rise in prices caused by irrational buying and intense speculation. Parabolic Arc patterns are rare, but they are reliable and are generated in mega bull trends. These patterns trend gradually making higher highs and lower lows in the beginning stages but can be volatile in the exhaustion and reversal stages.
Often at the end of long bullish trends, a market goes into to what some analysts refer to as a blow-off top. Irrational buying in public generates a strong rally to push prices vertically, followed by a steep sell-off. Examples of these market types are the NASDAQ bullish markets during 1990-2000, which retraced 80%, and Gold prices from 2000-2011, which retraced 62%.
Parabolic Arc is a reversal pattern and has a very predictable outcome. Although these patterns are predictable, they are relatively difficult to trade since the market sentiment is bullish and may be tough to point reversals to trade. Most Parabolic Arc patterns have a significant correction of 62-79% of its price rise (from the top).
They are difficult to trade as the nature of the pattern makes getting short early incredibly costly. In fact, one underlying reason for this pattern is sellers correctly seeing weakness but unable to turn the tide. When their short positions are stopped out it causes a more intense rally.
That is why there is no strategy for selling at the top of the pattern. Traders are looking to sell a bounce off of the initial reversal. Once Parabolic Arc patterns reach their target of 62% to 79%, they tend to reverse as an oversold bounce. Usually these bounces are between 25% to 50% of its prior drop from the peak.
Trading Parabolic Arc Patterns
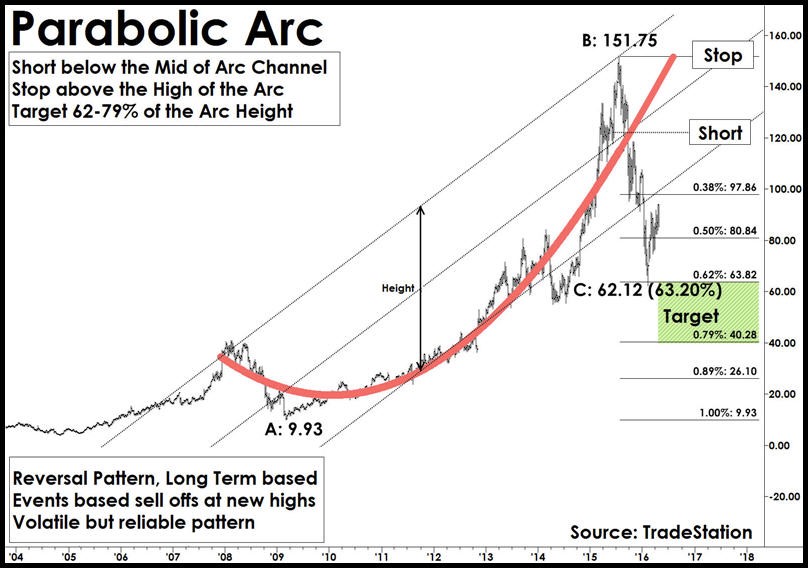
Trade: In Parabolic Arc patterns, prices move up vertically and eventually, the acceleration comes to a stop and then reverses. Prices start showing lower-lows and may attempt to regain the top again. Draw a channel connecting the top and bottom of the pattern. Enter a “short” trade at the breakdown of the channel trend line connecting the pattern high and pattern lows.
Target: Measure the distance of the rise from the base to the top of the pattern. Most Parabolic Arc patterns return to the 62% to 79% of its rise; 50% is the first target.
Stop: Protect the trade by placing a few ticks above the high of the Parabolic Arc.
