


正文
1. ES daily printed a doji like red candle which further complicated the short term outlook. Since a doji implies reversal and a red candle indicates weakness. We got 2 daily closes under the PL (51) now and if we get another close below PL tomorrow the likelihood of future weakness is high. A piece of good news comes from the close which is right at the important 44 level. Also the next support (34.5) was tested TWICE today and held. If tomorrow ES decides to test 34.5 again I think it will likely fail. So that is the last meaningful defense for bulls before 1811 or under 1800. Daily indicators are mixed and considered as neutral. PL still above TBL and a close above PL (51) or better above 58 tomorrow will change this picture dramatically and favors a bullish scenario. That shows just how delicate the current TA outlook for daily ES is.
2. The 3-H chart shows once the lower channel line gave away ES weakened further. Although the close of last two candles were all under 44, selling pressure has subsided somewhat and the last two candle actually printed a bullish harami pattern. Although in general harami is a not very reliable candle pattern it still useful if you look it in the right context. PL starts to level off (sellers finally met with buyers and a temporary equilibrium has been reached). Indicators are still all bearish. There is an ongoing Head/shoulder pattern on 3-H chart which suggests a 1810s ST target if it completes tomorrow. That is the target I think ES is heading to if 34 fails tomorrow.
3. Short term RS Levels: 81, 75, 66-7, 62-3, 56.5, 51-2, 48, 45.5 zone, 41-2, 34.5, 28, 23, 11.5
Daily
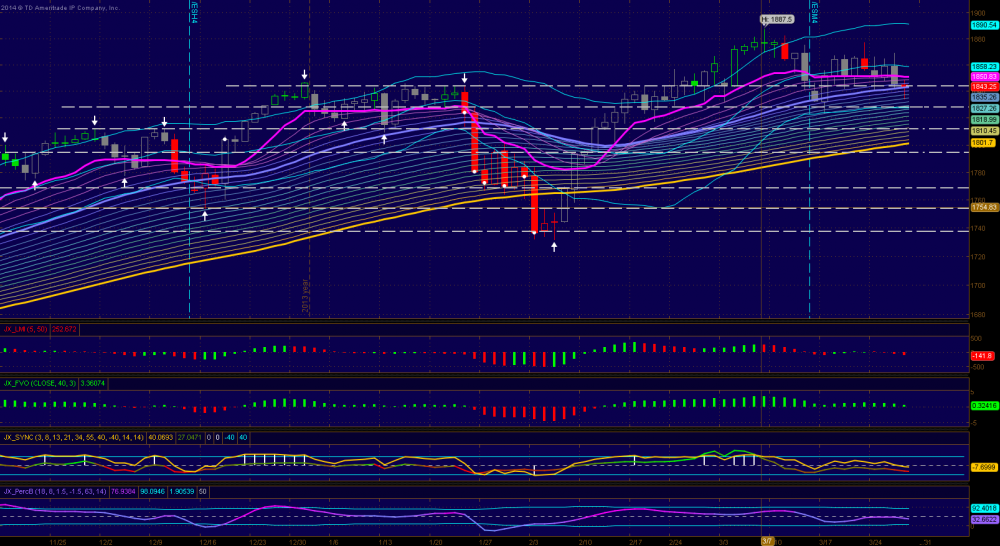
3-Hour

2. The 3-H chart shows once the lower channel line gave away ES weakened further. Although the close of last two candles were all under 44, selling pressure has subsided somewhat and the last two candle actually printed a bullish harami pattern. Although in general harami is a not very reliable candle pattern it still useful if you look it in the right context. PL starts to level off (sellers finally met with buyers and a temporary equilibrium has been reached). Indicators are still all bearish. There is an ongoing Head/shoulder pattern on 3-H chart which suggests a 1810s ST target if it completes tomorrow. That is the target I think ES is heading to if 34 fails tomorrow.
3. Short term RS Levels: 81, 75, 66-7, 62-3, 56.5, 51-2, 48, 45.5 zone, 41-2, 34.5, 28, 23, 11.5
Daily
3-Hour

评论
10things
2014-03-28 05:24:35
回复
悄悄话
Cool, thanks,
CCCCCC2010
2014-03-28 04:47:19
回复
悄悄话
Thanks
回乡偶书
2014-03-27 20:27:33
回复
悄悄话
老大,谢谢!
登录后才可评论.