股色股香
博客内容大多数收集于网上,如有版权之纠纷,敬请告知。By Richard Moore
RealMoney.com Contributor
4/11/2007 12:43 PM EDT
URL: http://www.thestreet.com/funds/maxira/10349436.html
Editor's note: As a special feature for April, TheStreet.com is offering a seven-part series on maximizing your IRA. It's not too late to open one for tax-year 2006 -- the deadline is April 17. Today's installment is part 5.
In theory, once you decide how much risk you are comfortable taking, you should be able to set your asset allocation more or less on autopilot, adjusting it gradually to become more conservative as you approach retirement age.
But even the most committed buy-and-hold investor is likely to be tempted to time the market now and then.
What happens when the market environment changes, leading you to change your expectations about future returns? Should you stick to your benchmark asset allocation?
For the vast majority of individual investors, the answer is "yes." But this is a qualified answer, because I firmly believe that it is possible to successfully time the market. It's just that few people have the ability to do so.
Why? Because it is extremely difficult to remain unemotional and committed to a set of principles that will allow an investor to move in and out of asset classes profitably. And in order to achieve above-average results, one must remain independent and unemotional.
Remember, the financial markets are very efficient. Every minute of every day there are very smart people analyzing every aspect of the economy and the capital markets in order to achieve a small edge over the competition.
For most of us, trying to beat the market by watching investment shows on TV, reading the money section in the newspaper or following various investment blogs on the Internet is largely a waste of time.
I view my role, when looking at the stock market, as one of an interested observer. I follow the market, but I largely ignore the opinions of market pundits. While there are a couple of commentators who command my respect, I still maintain my independence when making investment decisions.
I have found the best way to do this is to use mainly technical and psychological indicators to gauge the current level of risk. These indicators are long-term in nature. I don't have knowledge of anything that works in the short term to forecast future stock market direction. However, I believe there are basic principles that can be used to avoid highly risky environments and also to identify low-risk market entry points.
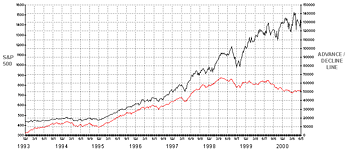
One technical indicator that I follow regularly in order to measure internal stock market strength is the weekly advance-decline line shown in this chart:
| Early Warning System Advancers vs. decliners measures broader-market strength |
 |
| Click here for larger image. |
This chart shows the S&P 500 in black and the weekly advance-decline line in red. This indicator starts at zero and then, each week, adds the number of issues that advanced last week and then subtracts the number of issues that declined last week. This is a measure of strength in the broad market and will show divergences when changes in a trend are likely.
This chart shows the period from early 1993 until mid-2000, when the market peaked and subsequently declined precipitously for over two years. Notice that the red advance-decline line tracks right along with the S&P 500 until mid-1998, when the advance-decline line starts going lower in spite of new records being made by the S&P 500.
This is a sign of deteriorating strength and should have been one strong warning indicator that the market was in particularly risky territory. Reducing equity market exposure in this period would have been the appropriate thing to do, but the investor would have had to have a principled stance to avoid getting pulled back in to an extremely frothy market at the time.
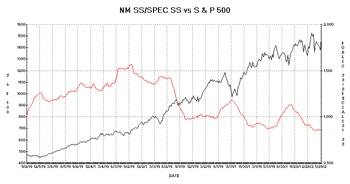
I also attempt to track actions by groups of investors that I consider to be the smartest part of the stock market and compare their actions with moves taken by the weakest groups in the market. This next chart compares short selling by the public to short selling by specialists who actually make markets in various stocks:
| Tracking Public vs. Professional Investor Sentiment Short-selling by public to that of specialists |
 |
| Click here for larger image. |
This chart covers the period from late 1994 until mid-2000. The black line is the S&P 500. The red line is a 16-week moving average of the ratio of nonmember short selling to specialist short selling. When this ratio is high, the public is pessimistic relative to specialists, and when the ratio is low the public is optimistic compared with specialists. In those days, readings above 1.5 were extremely bullish while readings below 1.0 were bearish.
Notice how the line dips substantially below 1.0 in 1999 and then even lower in 2000. Also notice that each correction in the market results in less short selling by the public, indicating ever-increasing complacency in the public investor. This psychology is very typical of market tops and should have also led to a decrease in equity market exposure.
It's possible to remain unemotional and move assets in and out of the stock market at opportune times and, thereby, improve the all-important risk/reward matrix. But it can only be done with a well thought out and consistent investment approach that is not affected by the madness of crowds.
Coming up next: Stock-picking techniques.


