子夜读书心筆
写日记的另一层妙用,就是一天辛苦下来,夜深人静,借境调心,景与心会。有了这种时时静悟的简静心态, 才有了对生活的敬重。


Some investors use the 200-day simple moving average (alternatively the 40-week or 10-month average) as a primary trend line indicating an upward or downward moving market. Some also use it as a reference line around which the price or other moving averages oscillate.
It is easier to be motivated to be in a risk asset when the primary trend line is moving up than when it is moving down. Conversely, it is probably prudent to limit risk commitments when the primary trend line is moving down, even when other fundamental or technical factors suggest opportunity.
There is no magic to 200-days, but it is probably most widely used, making it likely that large numbers of investors will be responsive to it. Other longer or shorter periods may “fit” better with different securities which have different cycle characteristics.
Keep in mind that longer averages are slower to recognize changes in the trend, but present fewer false positives; while shorter averages are quicker to recognize change in the trend, but present more false positives. Each investor must choose his or her balance between trend recognition lag time and the whipsaw effect of false positive signals.
Some Multi-Year Examples:
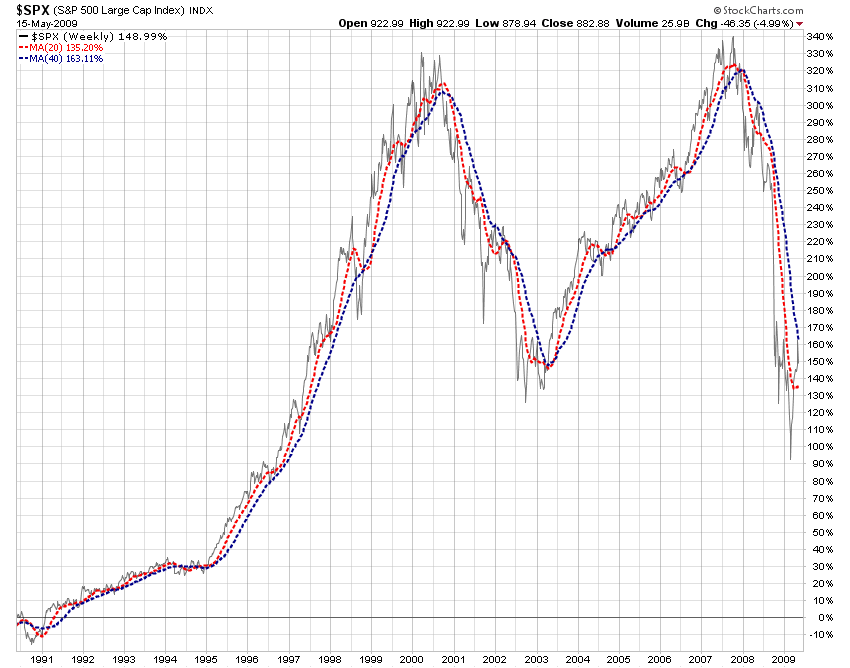
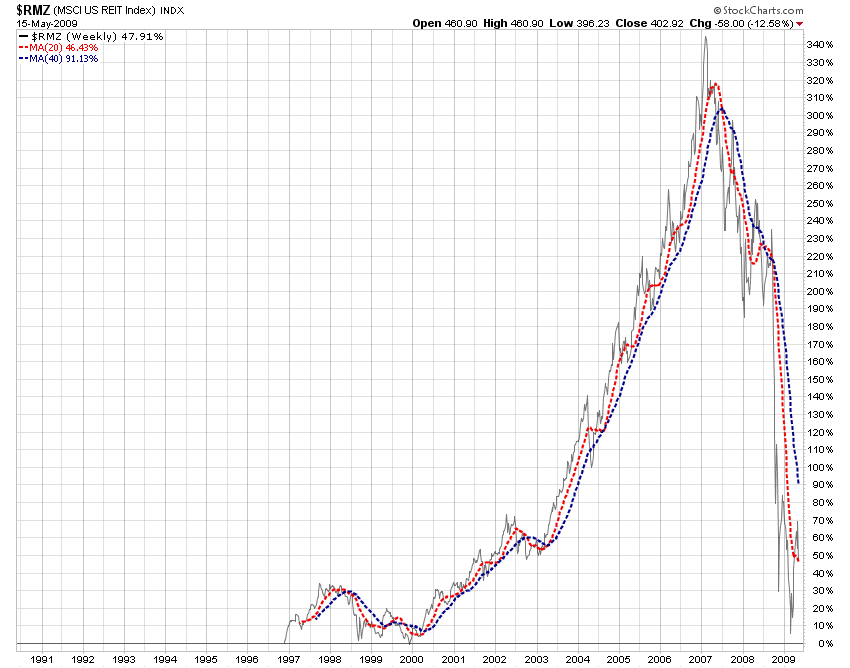
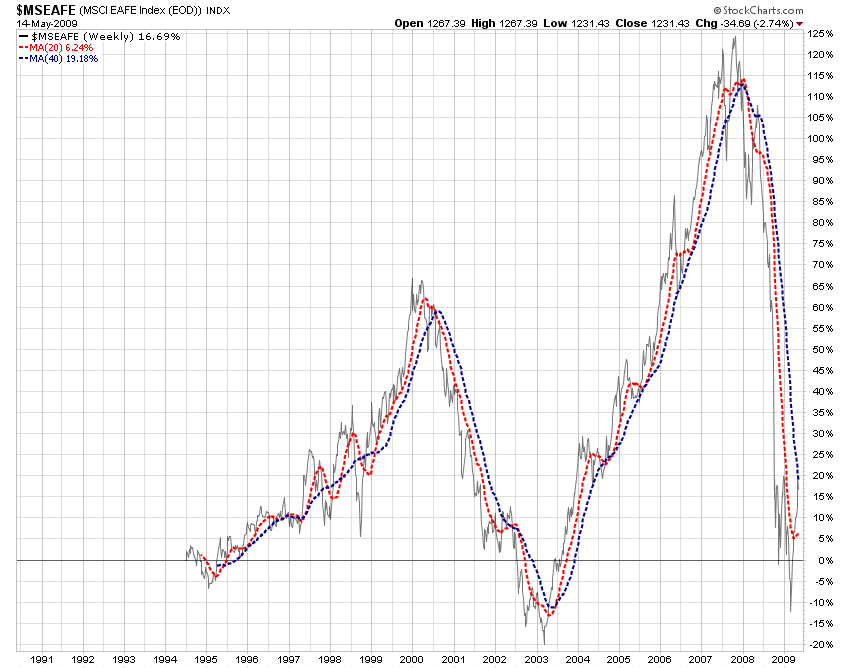
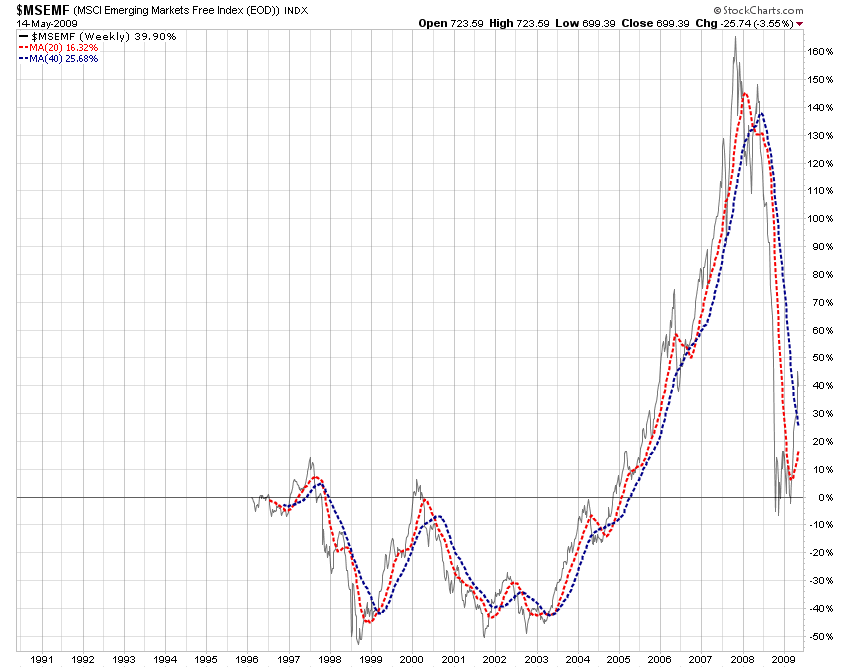
These seven examples use the 40-week moving average of the price as the primary trend reference line, and the 20-week moving average as a signal line.
The idea is that when the signal line is above the reference line, there is strong upward pressure on the primary trend. If the primary trend is sloping up, it is likely to continue to move up. If the primary trend is down, there is a reasonable probability that a trend reversal has occurred or is about to occur.
If the signal line crosses below the reference line, there is strong downward pressure on the primary trend. If the primary trend is sloping up, it is subject to reduction in upward slope or possible reversal. If the primary trend is down, the downward slope is likely to become steeper.
It would be helpful when interpreting the risks to see the price confirming the superior or inferior position of the 20-week relative to the 40-week average.
Please do take note of the words "probability", "likely", and "possible". No indicator is perfect. All indicators give some level of false positives. The key is to select indicators that have the lowest false positive rate consistent with your investment time frame, risk tolerance and degree of active management.
The 40-week/20-week approach is fairly conservative and results in a low frequency of buying and selling in the US stock market, and in some others as well.
Here are multi-year views of the 40-week/20-week approach for seven important indexes:
US Stocks (S&P 500)
MSCI US Equity REITs
MSCI EAFE Stocks
MSCI Emerging Markets Stocks
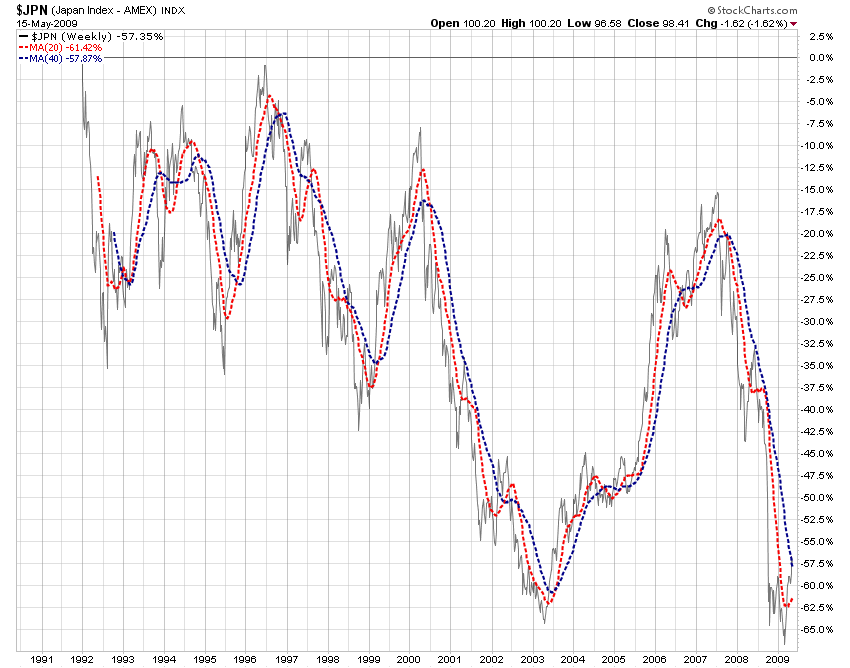
AMEX Japan Stocks
DJ-AIG Commodities

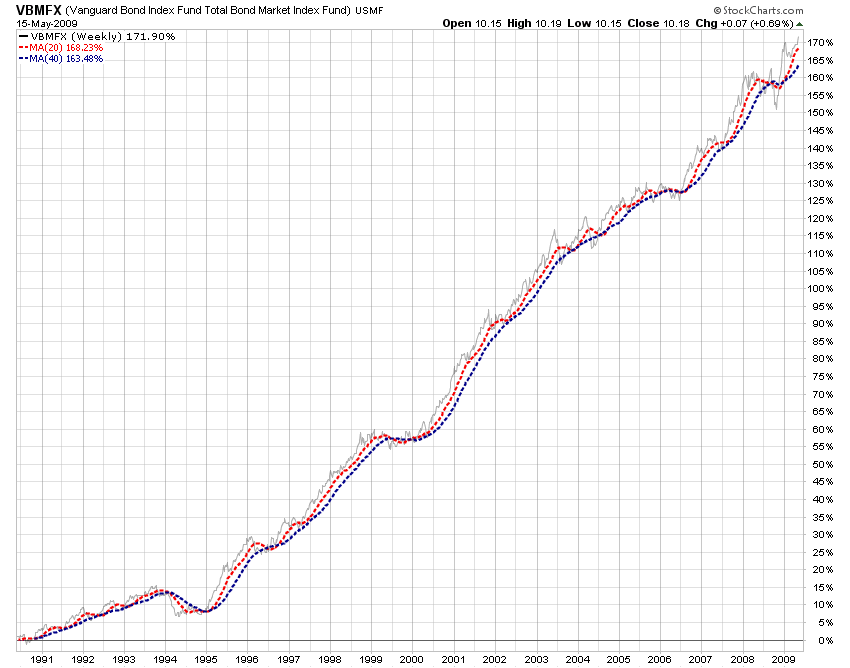
US Aggregate Bonds (Vanguard Fund)
(Some securities related to the charts: SPY, IVV, VFINX, IYR, VNQ, EFA, VEA, EEM, VWO, EWJ, DJP, DBC, AGG, BND, VBMFX.)
For all of the indexes reviewed, except for bonds, the 20-week average is below the 40-week moving average, suggesting that they remain in primary down trends. Bonds appear to be in a primary uptrend.
You can judge for yourself how useful this method may or may not be for your purposes. At a minimum, it may be useful as general information to factor into your overall risk and opportunity evaluation process.
Disclosure: We own some of the related securities in some accounts
