子夜读书心筆
写日记的另一层妙用,就是一天辛苦下来,夜深人静,借境调心,景与心会。有了这种时时静悟的简静心态, 才有了对生活的敬重。Ritholtz: Ten Bullish Charts, Signals and Indicators
Barry Ritholtz
This is an expanded version of a research commentary sent to institutional and managed asset clients of FusionIQ on Friday, Oct. 10 at 1:00 p.m.
For the past couple of years, I have been rather negative on the economy, on the housing market and on the stock market. Recall our "Cult of the Bear" article from January 2006 lead out the many potential dangers the economy was facing. With the Dow now under 8000 and the S&P below 850, it is time to put that perspective away, and begin to prepare for the eventual rebound.
A few caveats are in order before we begin. First, bottoms are a long process. Given the extent of the credit crisis, and the depth of the current recession, we are looking not for a "V" bottom, but for a gradual improvement in equities from the deeply oversold levels.
Second, we believe in slowly deploying capital rather than trying to "guess" at a bottom. Third, we believe that patience is a virtue, and anyone making the purchase this day, week or month is doing so with a six- to 18-month window and not a tick bite to return.
Regardless, we see many signs that suggest a reasonable upside move is an increasingly high probability. What brings us to this conclusion? It isn't the economy. And the credit situation is even worse than it was a week ago. Rather, with rampant fear and prices now off more than 40% from their year ago highs, we like the odds of a 15%-25% rally sometime in the immediate future.
 Note that this is not based on a gut feel, hunch or instinct but on several of our favorite quantitative indicators that track when markets reach absurd extremes. This appears to be one of those times. What follows are 10 factors that suggest to us an upside trade is more attractive from these levels.
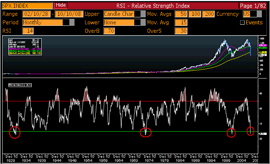
1. Relative Strength Indicator, SPX, 1928-2008
Since the S&P 500 was formed in 1928, its monthly relative-strength indicator has dropped below 30 on just four occasions: the 1929 lows, the 1973 lows, the 2002 lows and this week. We like those odds as entry points for long positions.
| S&P 500 Relative Strength, 1929-2008 |
 |
| Click here for larger image. |
| Source: Bloomberg |
2. SPX Losses
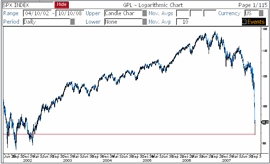
The S&P has given up nearly the entire gain from the 2002-'03 period. This sort of action reminds us of other long trading ranges. Recall 1966, when the Dow first hit 1000, to 1982 when it got through it on a permanent basis.
Over that period, there were five major rallies and selloffs. My suspicion is that the 2003-15 market is likely to be a very rangebound market. Now that this five-year rally has completely sold off, it is setting up for the next leg up (very 1973). Note that these were not buy-and-hold rallies, but six- to 18-month trades.
| S&P 500 Retest |
 |
| Click here for larger image. |
| Source: Bloomberg |
3. Dow Components and the 200 Day Moving Average
All 30 Dow stocks are below their 200-day moving average -- a condition that has only occurred once. The last time was right after the 1987 crash.
4. Cash Allocation
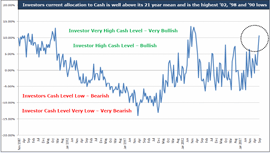
Investors' current allocation to Cash is well above its 21-year mean, and at the highest levels since the 2002, 1998 and '90 lows.
| Cash Allocation |
 |
| Click here for larger image. |
The last few times were close to these levels was October 1987 and March 2003.
5. 90/10 days
Paul Desmond of Lowry's Reports (interviewed here) has studied every major market bottom going back to 1900. One of his discoveries was that as we approach the bottom of the selloff, the ratio of downside volume to upside volume approaches 9:1. Several of these represent major distribution by funds, and a low cannot be put in until selling exhausts itself.
When a 90% upside day shows itself, that suggested institutional buyers are coming back into the market.
This week has seen three 90% downside days, reflecting massive liquidations, and Friday is likely to be the fourth. They can only continue for so long before investors run out of shares to sell.
As noted above, scaling into long positions is the smart approach. We would become more aggressive buyers after the first 90% upside day. This has historically created a good entry for a one- to three- to six-month holding period.
6. Percentage S&P 500 over 200-Day MA
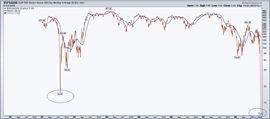
In the past, I have discussed the percentage of stocks over there 200-day moving average, on either the NYSE or the S&P 500. This is yet another quantitative method for determining when a move has simply gone too far in one direction.
| Percentage of S&P 500 Stocks Over Their 200-day Moving Averages |
 |
| Click here for larger image. |
| Source: StockCharts |
Looking at that did it for today, we see that the percentage of stocks trading over their moving average at the NYSE is down to 6%, and on and on the S&P 500, it's about 1%. These are extreme levels, far below even the 2002 lows. Yet another historically excellent entry point.
7. Gold vs. SPX
The cost of an ounce of gold is now greater than the S&P 500; This last occurred in the early phase of the 1982-2000 bull market, sometime around 1984.
At the peak of the 2000 stock bubble, one ounce of gold bought less than one-fifth of one unit of the S&P 500.
While the relationship is not at a horrific extreme, seeing the price of gold over the cost of the S&P 500 for the first time in nearly 25 years is significant.
8. VIX Moving Average
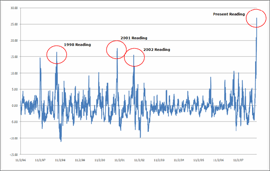
The VIX (AKA the Fear Index) hit a multiyear high of 70.90, reflecting extreme levels of emotion in the markets. We like to look at this on a 50-day moving average
VIX Deviation From 50-Day Moving Average
| VIX 50-day Moving Average |
 |
| Click here for larger image. |
Readings above 15 over the last 10 years have produced significant rallies. The present reading on this indicator is 26!
--1998 Reading -- Market Up +27% (three months later) and +36% (six months later)
--2001 Reading -- Market Up +22% (three months later) and +22% (six months later)
--2002 Reading -- Market Up +14% (three months later) and +19% (six months later)
If History bears out, this should be a good buying opportunity with a three- to six-month horizon.
9. Losses of 45%-47% in the major indices
The S&P 500 is down 47% from its peak level one year ago, the Dow is off 45%, and the Transports are down 38%. These are relatively rare degrees of loss. Other than 1929 for the Dow, and 2000 for the NASDAQ, these losses have set up a near-term upside move.
Specifically, this sell off is the third-worst decline without a 10% rally on record. According to Bespoke Investment Group, the two that were worse were June 1931 to October '31 (-42.5%) and March 1932 to June '32 (-51%).
10. 2008 vs. 2002
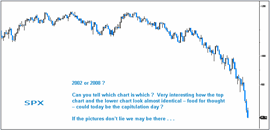
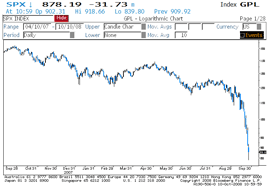
The following two charts show the 2002 lows and the current market. Can you tell them apart?
 |
| Click here for larger image. |
 |
| Click here for larger image. |
 The first chart is 2002, the second chart is current as of Oct. 10, 2008.
This was originally published on RealMoney on Oct. 13, 2008. For more information about subscribing to RealMoney, please click here.


