In a little over a month, the S&P 500 has declined more than 11%, giving back all of its gains on the year.
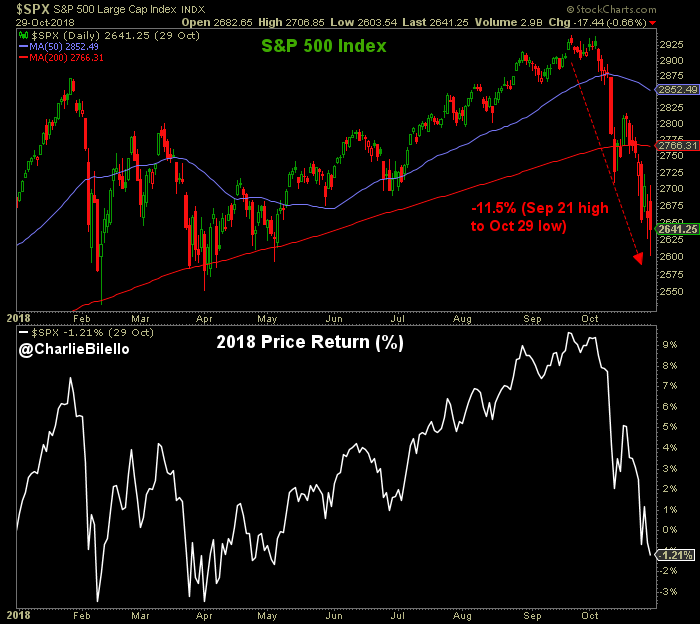
This is the largest decline since … well, earlier this year. Corrections in markets are the norm, not the exception. Since March 2009, there have been 23 of them…
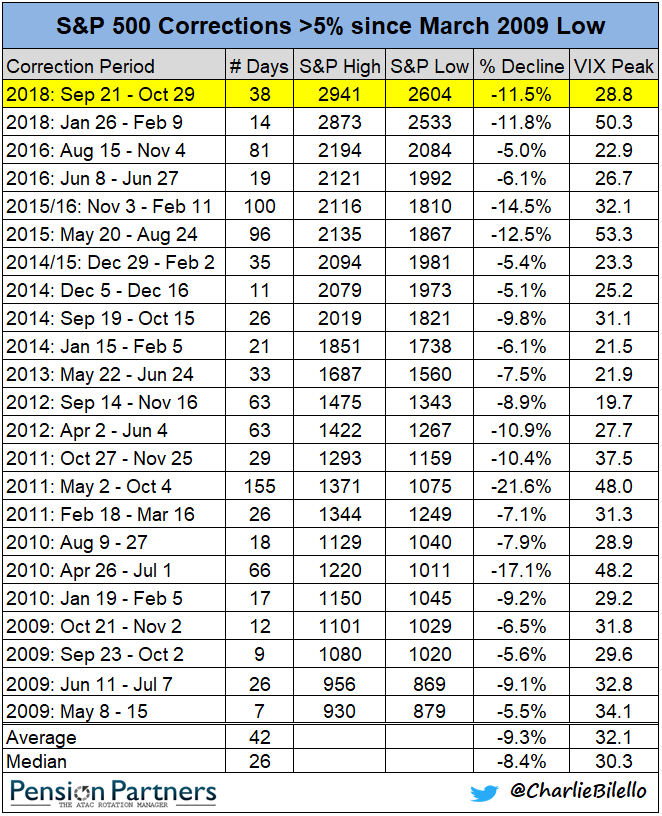
That said, all corrections are not equivalent. There are shallow corrections where little technical damage is done and new highs are achieved shortly thereafter, and there are deeper corrections where the recovery period can be lengthy, measured in months or even years.
When a decline starts, it is impossible to tell which kind of correction you are dealing with. But at a certain point, signs tend to present themselves.
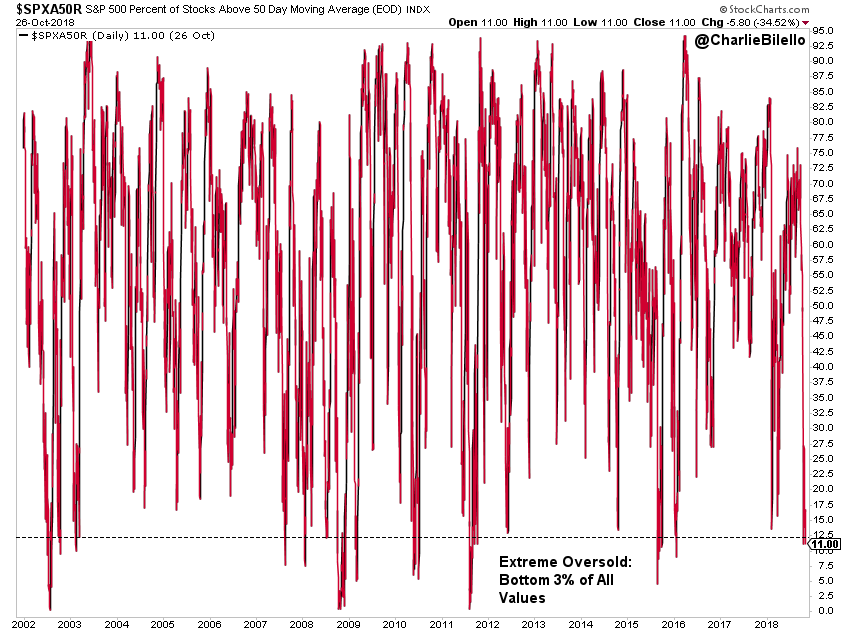
One of these signs is an "oversold extreme" condition rarely seen in shallow corrections. A way to quantify such an extreme is to measure the percent of stocks in the S&P 500 above their respective 50-day moving average. When the percentage reaches a very low level (few stocks above the 50-day), it can be a sign of indiscriminate selling.
We're seeing that today with only 11% of stocks above their 50-day moving average. This is more oversold than 97% of historical readings (data goes back to December 2001).
What happens after such oversold extremes are reached?
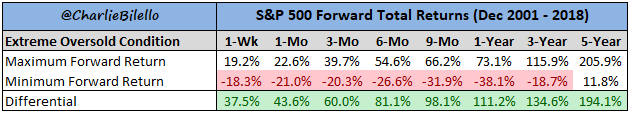
Stocks tend to bounce, with above average forward returns in most periods with a higher probability of a positive return than your typical trading day. Over the subsequent 1-year period, stocks have gained an average of 22.7% with positive returns 93% of the time following extreme oversold readings versus a gain of 9.9% and 84% positive in other periods. Looking out five years into the future, stocks have posted positive returns 100% of the time following such readings.
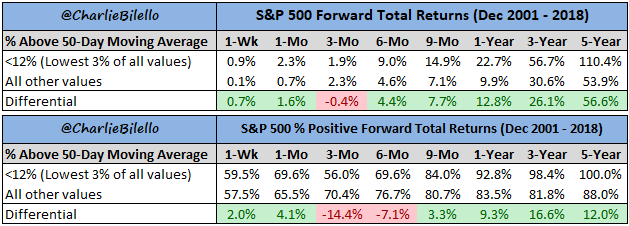
These are just averages, of course, masking the wide range of outcomes that have actually occurred.
This is another way of saying that bounces come in many forms. Let's take a look…
The 5 Kinds of Bounces
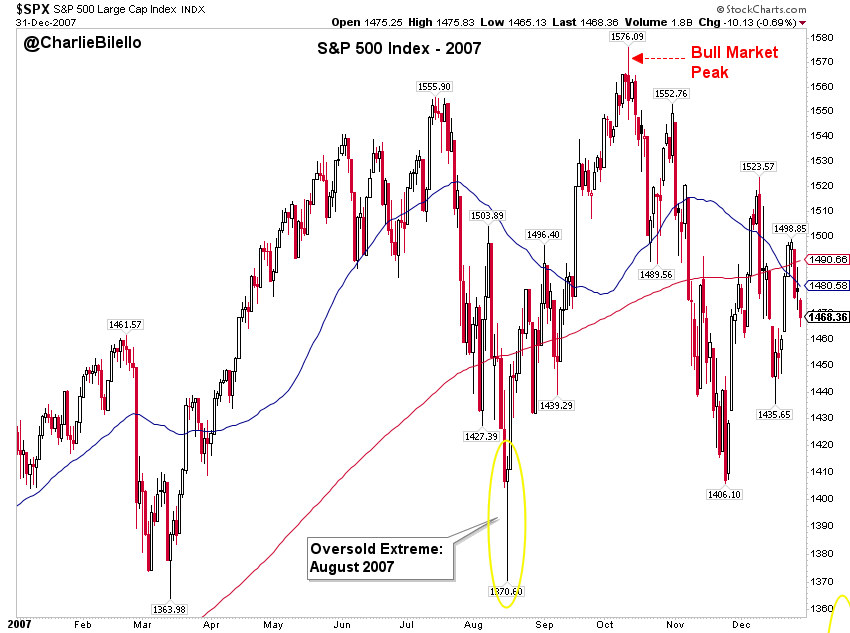
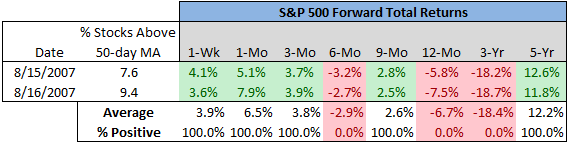
1) The Last Hurrah
The textbook example of the "last hurrah" is the August 2007 correction low, from which a sharp bounce (approximately 15%) took the S&P 500 back to new all-time highs in October 2007. This would be the last high for the S&P 500 Index until 2013. The worst bear market since the Great Depression (-57%) would follow.
2) The Dead Cat
In January 2008, the S&P 500 reached an oversold extreme with the index down over 19% from its October high. From the January low to its May high, the S&P 500 rallied over 13%, fooling many into believing that the cat who bounced after hitting the ground was alive and well. They would soon learn otherwise, with the S&P 500 falling 54% from its May 2008 high to its March 2009 low.
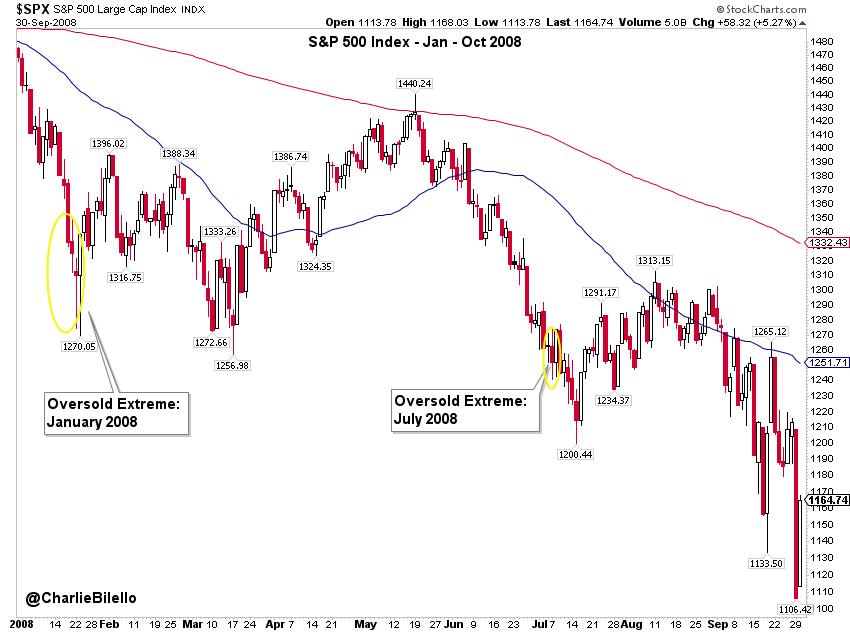
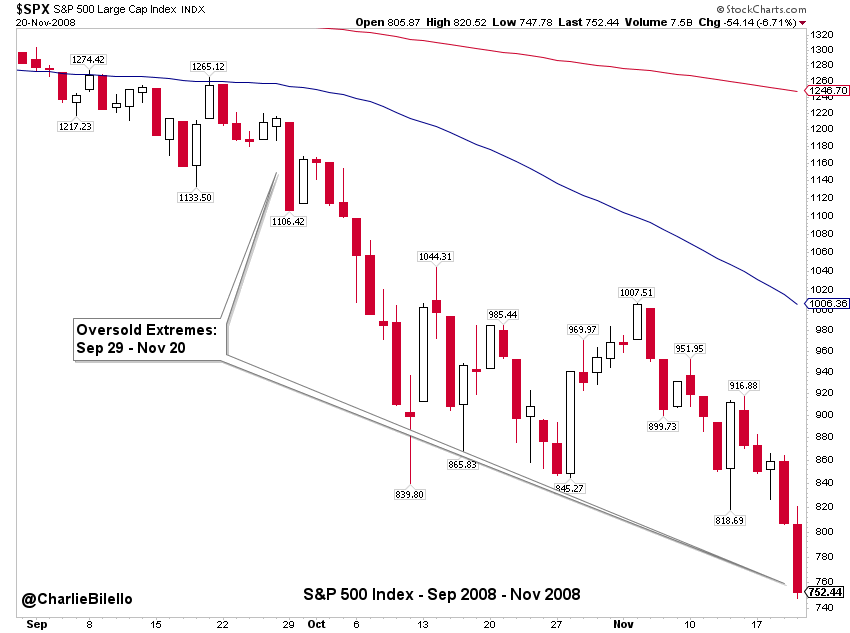
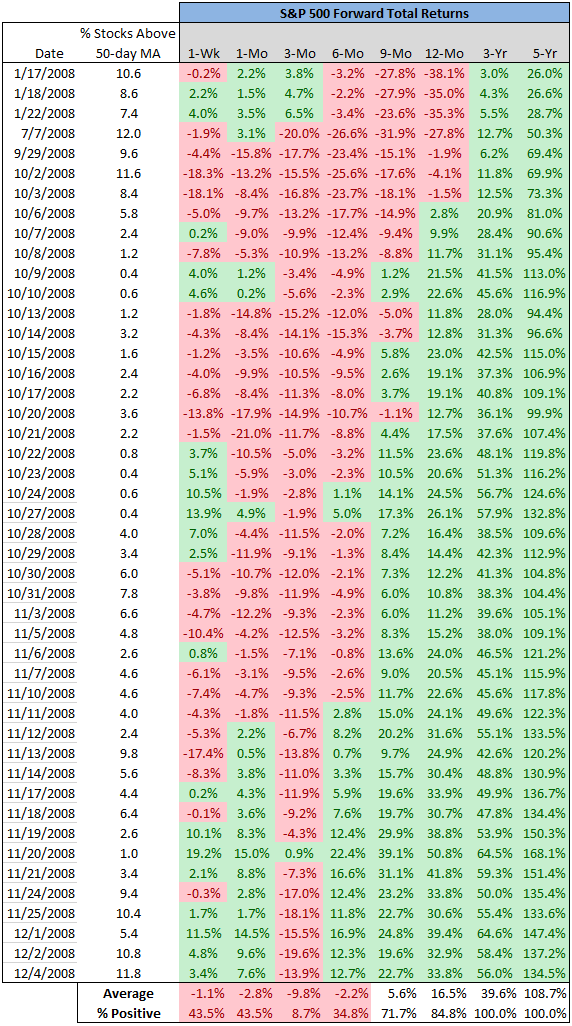
3) The Falling Knife
"Don't catch a falling knife" is one of the most popular of market sayings. What they never tell you is how to differentiate between a falling knife and one that has already hit the ground. On September 29, 2008, the S&P 500 reached an oversold extreme and was down 30% from its October 2007 high. It seemed like the worst was over. During the next 2 months, it would continue to hit oversold extremes almost on a daily basis, declining another 32% from the September 29 low.
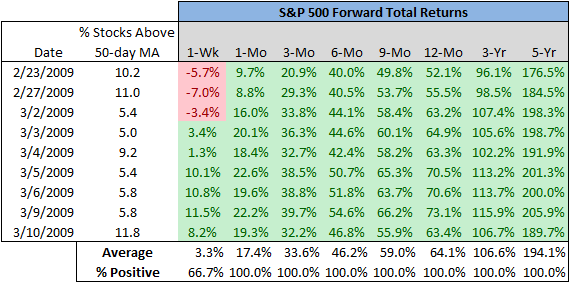
4) The Holy Grail
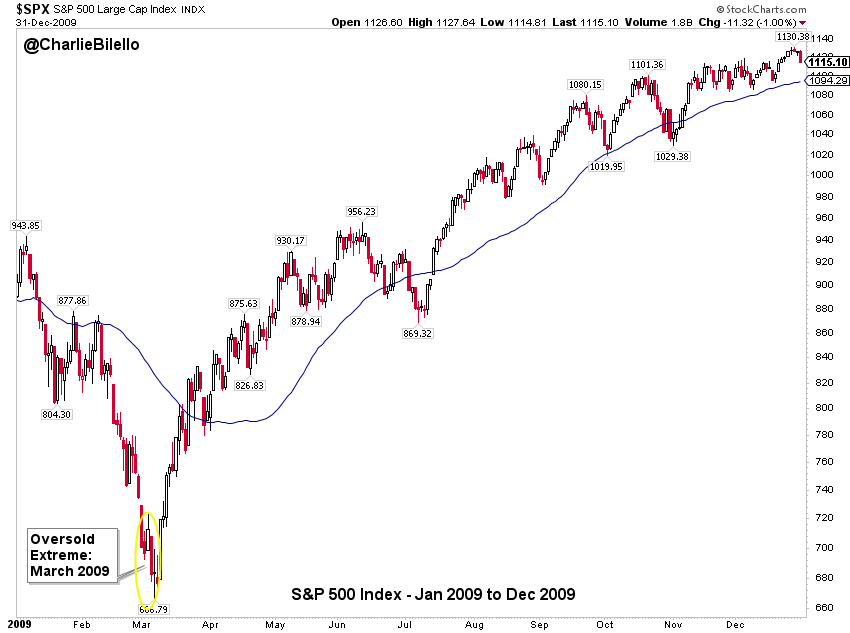
The best bounces come at the end bear markets, when the last oversold extreme is reached. In March 2009, we saw a series of these extremes, after which the market never looked back.
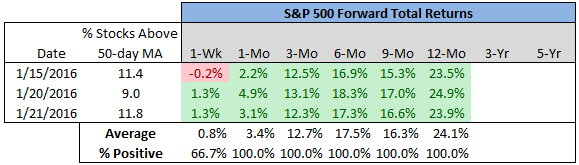
5) The BTFD
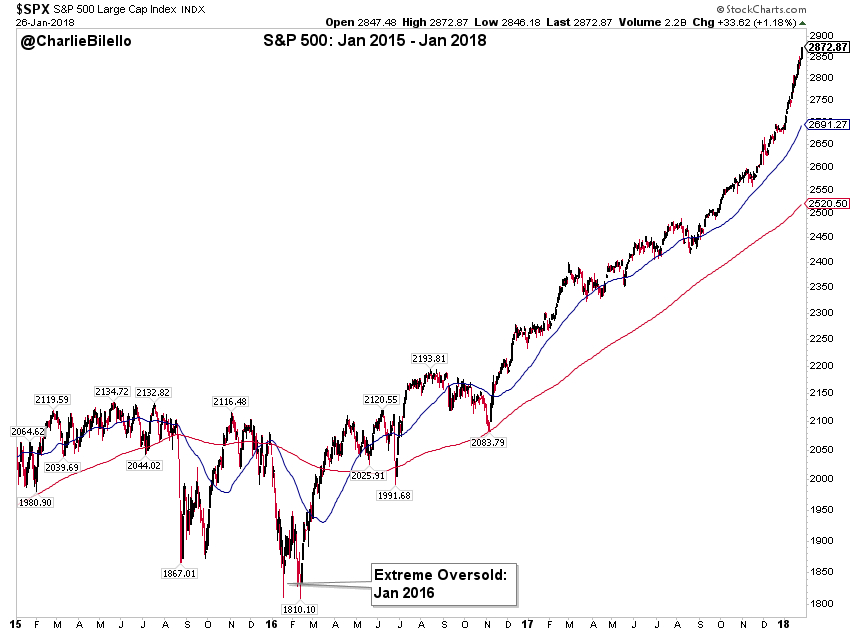
A favorite of the 2009-18 bull market run has been the BTFD (Buy The F****** Dip), where oversold extremes are hit and the market rallies higher in dramatic fashion until new highs are hit. We last saw the BTFD in early 2016.
Which of these bounces will occur today?
Since we are 9+ years into a bull market run, we can effectively rule out the holy grail option. But that still leaves us with the last hurrah (Aug 2007), the dead cat (Jan 2008), the falling knife (Sep 2008), and the BTFD (Jan 2016). Nobody can say with any certainty which one will occur because there is no script that markets follow.
The best we can say is that extreme oversold conditions tend to lead to above-average forward returns with a higher probability of a positive outcome than other periods. But these are just probabilities - there are many, many exceptions (see appendix below for full details on all readings). Will the current reading fall into the "tend to" category or the "exception category?"
That story has yet to be written.
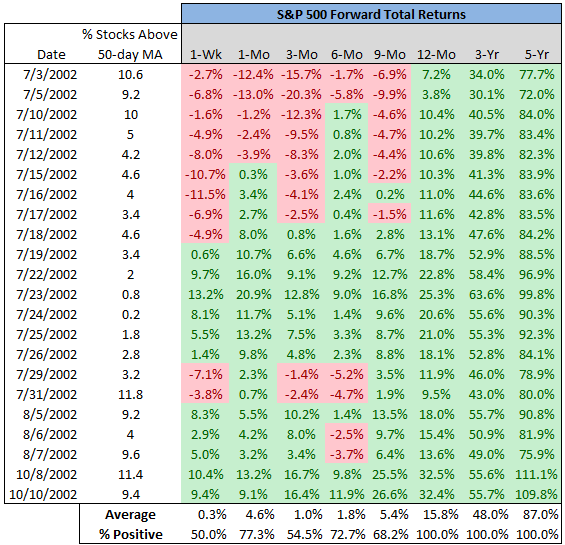
Appendix: S&P 500 Extreme Oversold Conditions, 2002 - 2018
2002…
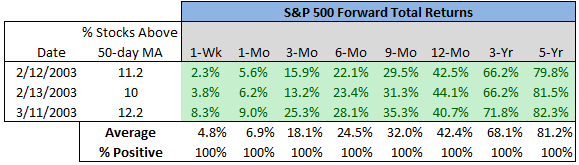
2003…
2007…
2008…
2009…
2010…
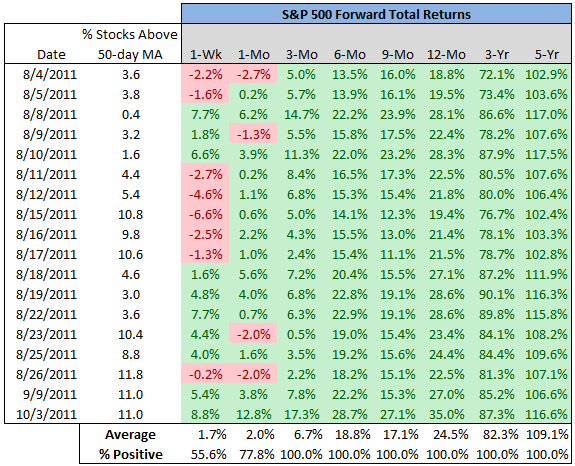
2011…
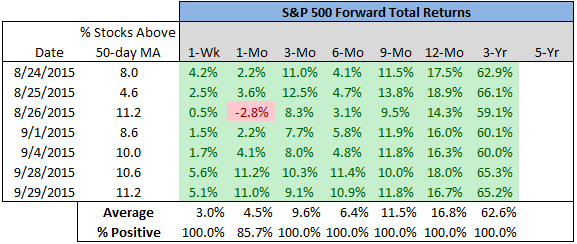
2015…
2016…
================