


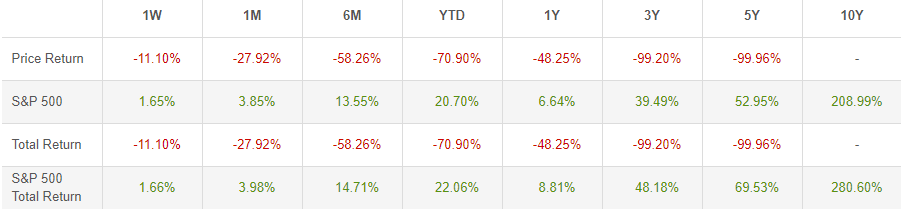
As you can see in the following table, the performance of the ProShares Ultra VIX Short-Term Futures ETF (UVXY) has performed fairly poorly for several years.
In this article, I will explain exactly why UVXY has such poor performance, as well as point out specific catalysts that suggest further above-average downside is in the cards for the ETF. In other words, if you were on the sidelines looking for a shorting opportunity, I believe the market is presenting one in the immediate future.
The Instrument
Before jumping into the immediate catalyst which I believe indicates further downside in the ETF, we need to talk about exactly what the fund actually is. There is a surprising amount of nuance when it comes to studying volatility ETFs and ETNs which can have radical implications for overall instrument returns.
From simply glancing at the performance table above, it can be seen that the actual return of holding the instrument for any period longer than 1 year has resulted in a virtual eradication of wealth. Investors who dabble in volatility ETFs really need to understand exactly what it is they are buying or selling and why instrument returns are almost constantly negative for many of the long volatility ETFs.
To understand the instrument, we need to start with its methodology and work backwards into a functional definition of what exactly the ETF seeks to accomplish. UVXY is an ETF which attempts to give a 1.5x return of the S&P 500 VIX Short-Term Futures Index. The VIX Short-Term Futures Index is a portfolio of monthly VIX futures contracts which has a weighted average maturity of one month into the future. How the index maintains exposure to volatility across one month is that it is required to roll positions from one month to the next on a daily basis in VIX futures.
When you roll exposure from one month to the next in the futures market, it results in something called roll yield. Roll yield is the gain or loss associated with holding a position in futures months, and it is caused by the tendency of futures prices at the back of the curve to trade towards the front of the curve as time approaches expiry.
When a market is caught in backwardation (in which the front contract is above the back contracts), roll yield on a long position will be positive because positions established at lower prices in back months will increase in value relative to positions in the front of the curve. When the market is in contango (front contract below back contracts), roll yield on a long position will be negative because positions established at higher prices will trade down in value towards the front of the curve.
The funny thing about VIX futures (which UVXY daily rolls exposure across) is that they are largely caught in contango for most of the time. The basic tendency of VIX futures is to assume that volatility in the future will be higher than volatility in the present unless there is presently stress in the market, so the contracts tend to trade in contango for months on end. However, during periods of heightened volatility in the S&P 500, VIX futures trade into backwardation (often dramatically so) and roll yield becomes positive.
This switch between contango and backwardation largely explains the price movements of UVXY.
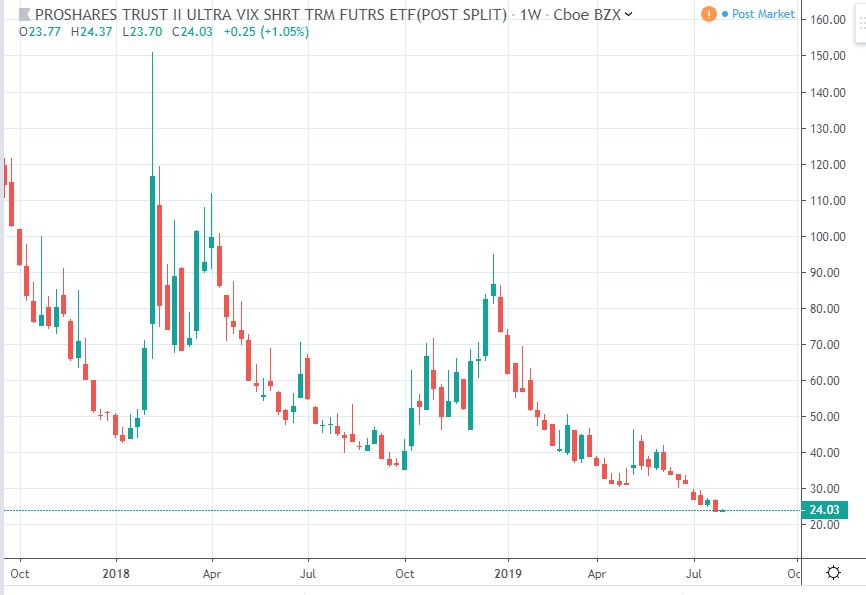
For example, higher volatility in the S&P 500 in early 2018 and late 2018 (each of which were associated with price declines in the S&P 500) led to dramatic increases in the value of the ETF in very short order. However, in the other “normal” periods in which the market calmly rose, VIX futures were largely in contango and UVXY largely fell in value.
The bottom line implication of the methodology of UVXY is that in general, the instrument is going to fall over time (as clearly demonstrated through its long-term returns). However, there are periods in which it falls at a quicker pace than average, as well as periods where returns are dramatically skewed to the upside. Now, here’s why I believe we are in for accelerated downside in the ETF and why I think you should either avoid it or look to short it.
Investment Catalyst
In general, volatility has no long-term trend, which means that it is largely mean-reverting. For example, the S&P 500 has an average trend of price increases in most years, whereas the actually underlying measurement of volatility spends most of its time between 9% and 15% on an annualized basis.
The fact that volatility reverts to the mean can be seen in the following chart which compares the past 50-day changes in volatility with the future 50-day changes in volatility.

The basic tendency of mean reversion can be clearly seen in the data: when volatility rises, it tends to fall in the future. When volatility falls, it tends to rise in the future. The outright level of volatility itself contains potential trading signals for UVXY in that when we reach the extremes in annualized volatility, a reversion to the mean is highly likely, as can be seen in the following chart.
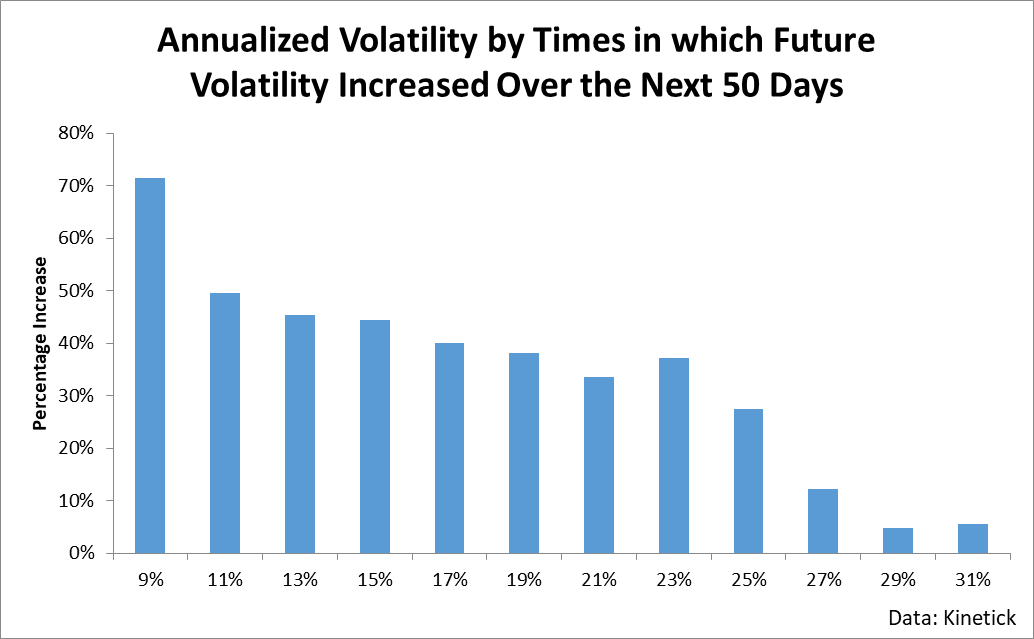
The above chart basically says that if the annualized volatility level is less than 11% or so, we are likely to see S&P 500 volatility increase over the next 50 days. Conversely, if the annualized volatility is over 20% or so, we are likely to see volatility contract over the next 50 days. These cycles of volatility represent trading opportunities in UVXY in that investors can limit their involvement in the ETF to locations in which the pendulum has swung to one side of the market.
The annualized level of volatility in the S&P 500 is actually fairly low right now at about 8%.

Historically, volatility levels these low are associated with higher levels of volatility in the future (even if just slightly so). However, there is a specific catalyst which suggests that the baseline expectation of mean-reverting volatility is unlikely to happen (at least over the next month).
Specifically, there is a strong tendency for volatility to contract in the S&P 500 at new highs in the market and for volatility to expand at new lows. As seen in the following chart, there is an above-average chance that we will see lower volatility when the S&P 500 hits a 50-day high.
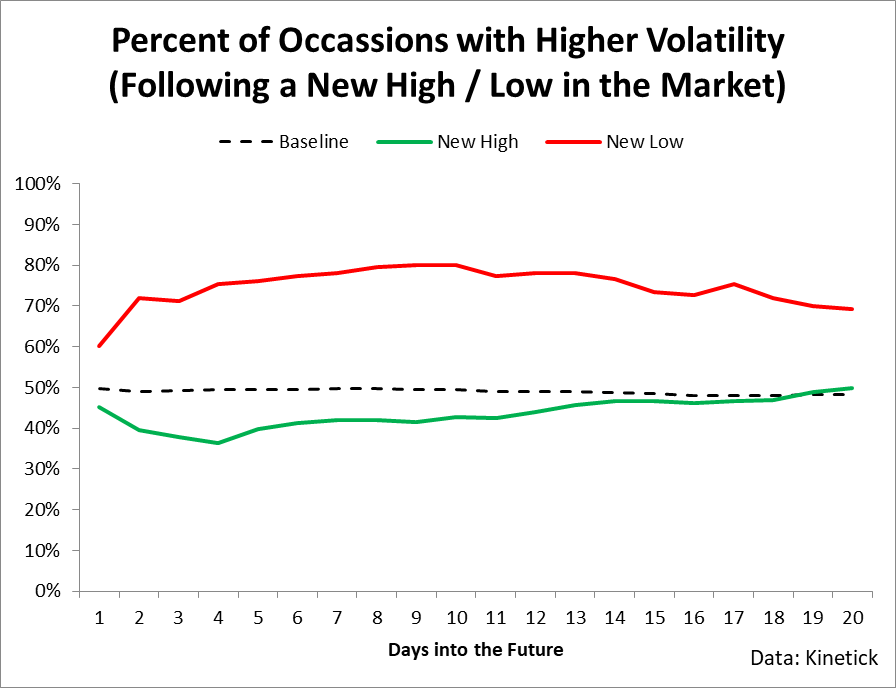
We have currently hit 6 new 50-day highs in the S&P 500 over the last month, and volatility has largely fallen as a result. This pressure against the highs is associated with a decrease in volatility in the S&P 500. When the volatility of the S&P 500 is subdued, VIX futures will largely trade in contango due to expectation of higher volatility in the future. When VIX futures are in contango, UVXY - which rolls exposure across the front two months of futures contracts - will see negative returns. For this reason, I suggest maintaining a short position on UVXY (with appropriate risk management in the form of stops in place). I believe that the statistical trading signal fades after about 1 month of the most recent new 50-day highs, so I expect accelerated downside for that time period.
The FOMC Meeting
Market participants in volatility-linked products are likely aware that this Wednesday will see the FOMC announce its rate decision. For this reason, substantial volatility could enter the market over the next week, so traders looking to short volatility may want to consider shorting after the announcement on the surge in volatility likely associated with the event. Ultimately, I believe that the statistical tendencies of volatility to fall following market highs will come into play, but investors need to be aware of the potential for strong volatility later this week.
Disclosure: I/we have no positions in any stocks mentioned, and no plans to initiate any positions within the next 72 hours. I wrote this article myself, and it expresses my own opinions. I am not receiving compensation for it (other than from Seeking Alpha). I have no business relationship with any company whose stock is mentioned in this article.

VXX puts are cheaper and have more volume for the same delta, and in fact in my tests the past few months I've actually had a better return despite UVXY having beta slippage.
Either way, if you average into a position on any pop you'll probably do fine, just use common sense on the amount of your account you risk. You can also try put spreads, or diagonals where you can sell OTM puts against a LEAP.
I would caution against call spreads unless you verify with your broker that you can borrow the shares when the short call gets assigned on a spike, and be sure you have the liquidity to short them. Some traders have been caught short when they were assigned and the broker closed their positions for a loss. since they weren't approved to short the "hard to borrow" UVXY.