


I know, you have heard this before. You have heard this for the past five years ad nauseum. Well, I don't care what others have been saying, I will say what I believe will happen. The problem with public predictions is they either make you temporarily great or destroy your reputation, unless you are a flip-flopping TV personality. People en masse seem to be attracted to flip-floppers.
I have stopped buying stocks and have 80% in cash and the rest in some beaten-down energy names and precious metals futures. Here's the major reason why:
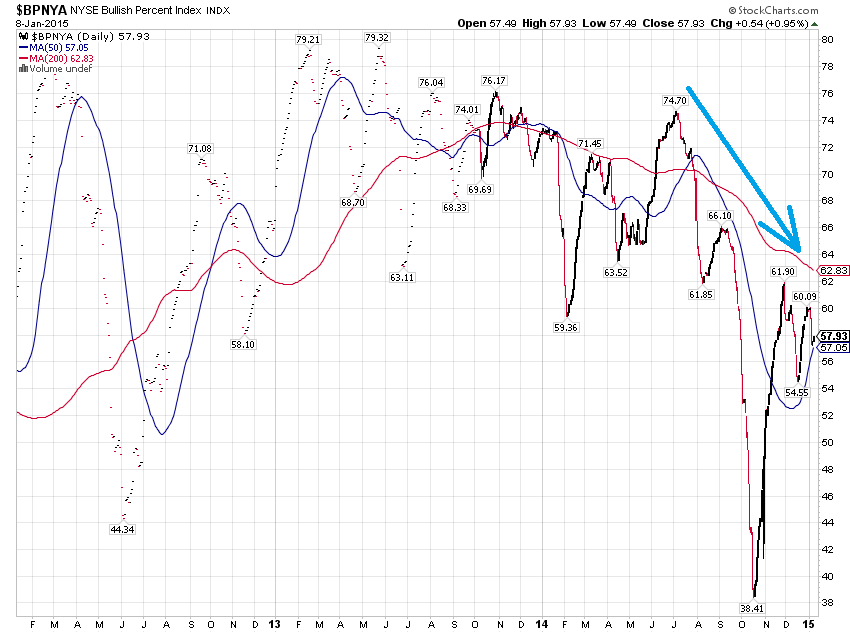
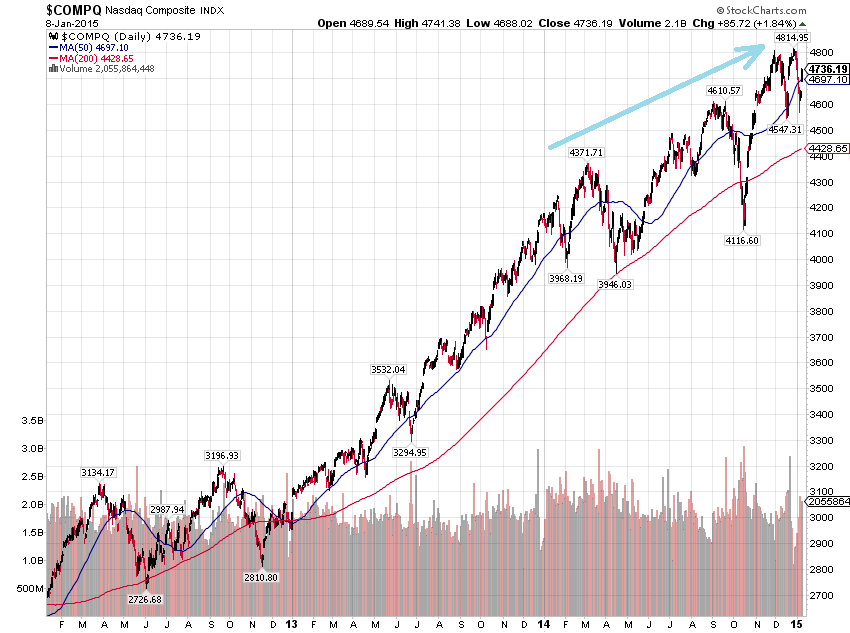
Compare the above chart with the one below:
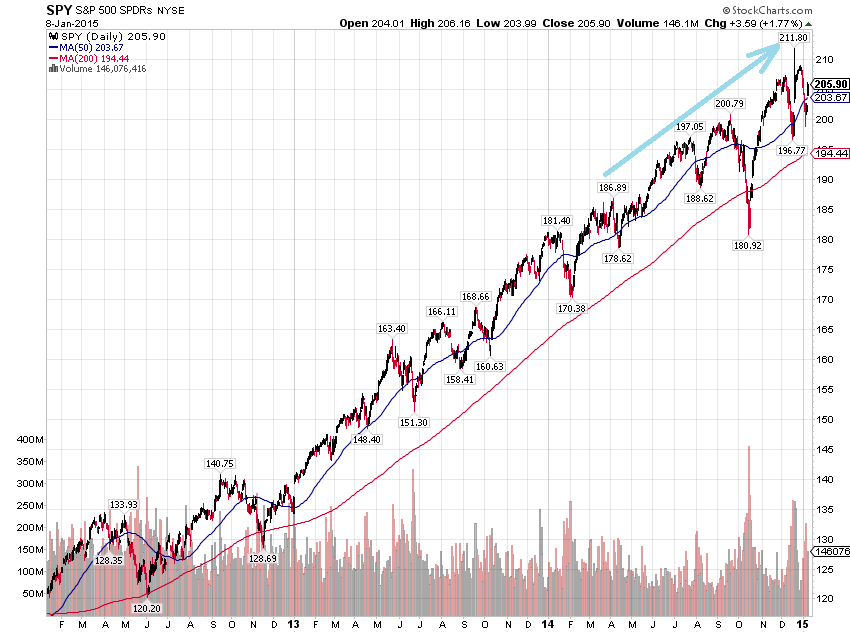
Fewer and fewer stocks have participated in the rally for the past several months. The percentage of stocks on NYSE, which are on P&F buy signals has been steadily declining as the market has been making higher highs. Note, that in 2012-2013 the rally was much more broad-based and the $BPNYA routinely exceeded 70%, which is an indication of a healthy market. Here's another way of looking at the overall situation:
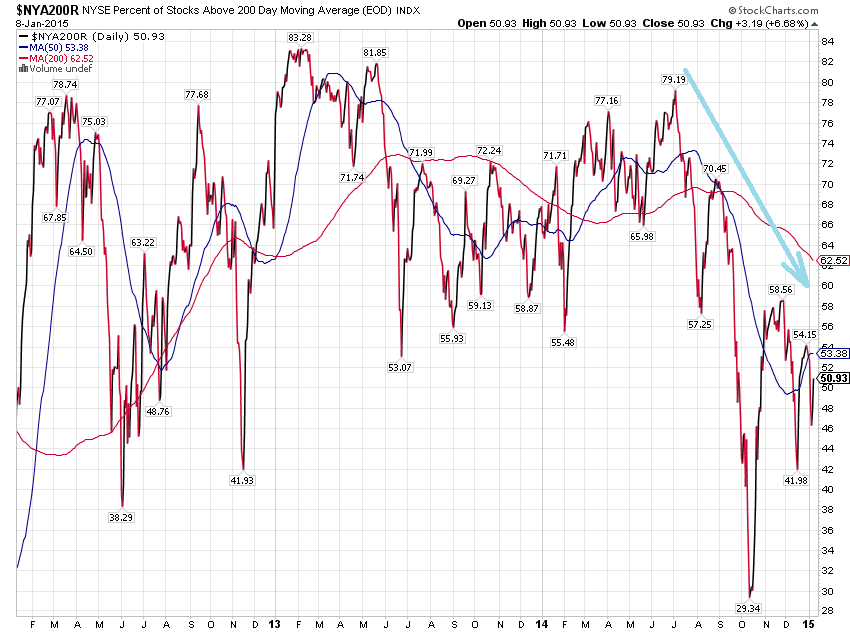
The percentage of NYSE stocks trading above 200-day moving average has been consistently lower as the overall market is moving higher. Only half the stocks on NYSE are above their 200-day moving average as the market has been making record highs in Q4 2014. The situation is similar with Nasdaq stocks. Despite uber-bullishness in the "internet of things" and biotech, many stocks in the index are not participating in the rally.
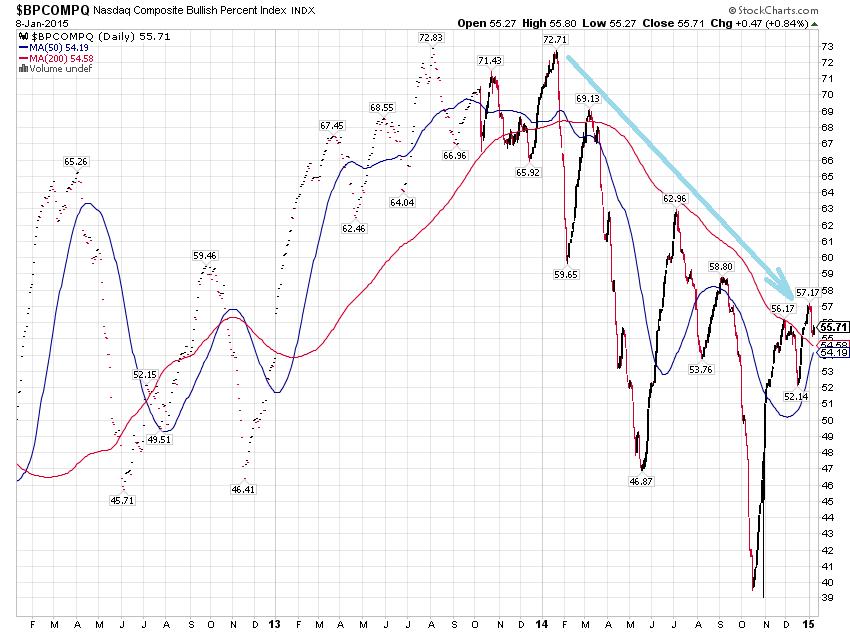
The situation is echoed by the ratio of Nasdaq stocks trading above 200-day moving average.
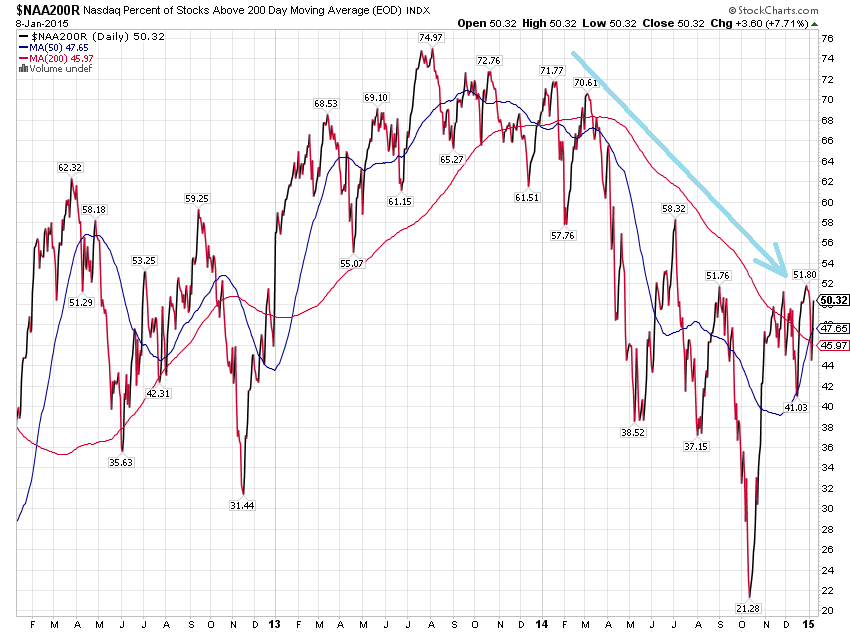
This is occurring all the while the composite is hitting new highs.
The rally over the past 12 months is supported by large-caps only. Below are $BP charts for S&P 100 and Nasdaq 100. Internals have been healthy for both, although the former is putting in lower peaks since June as the underlying index keeps climbing.
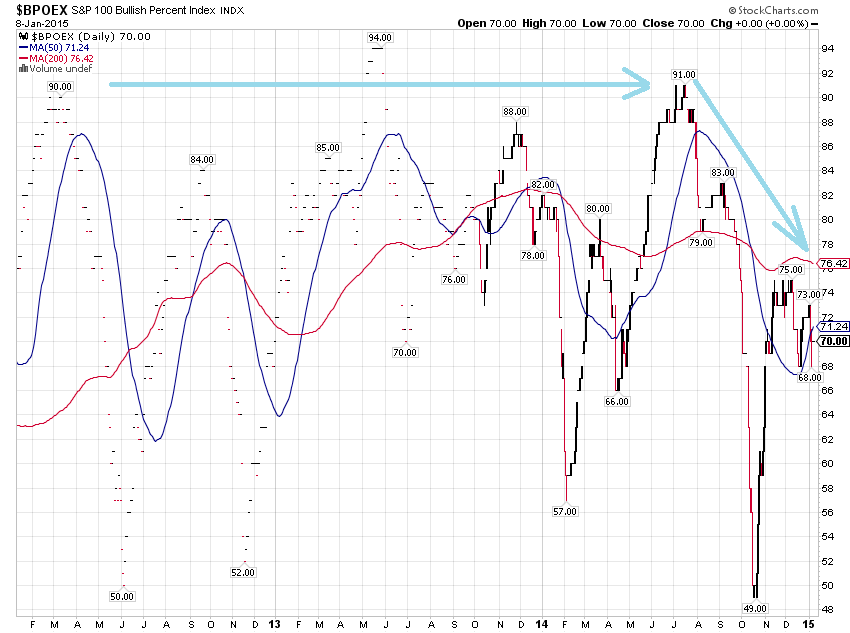
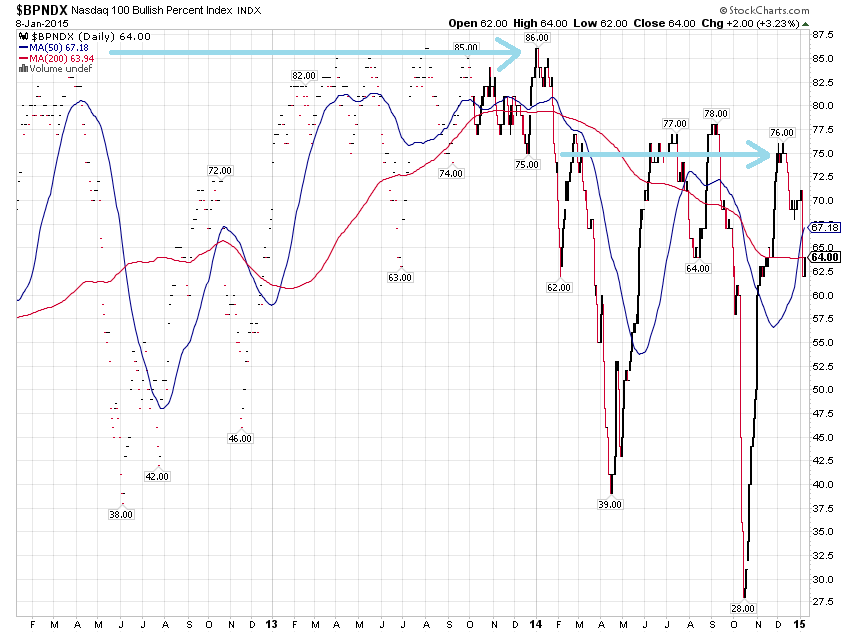
Large caps have kept 2014 rally afloat, but divergence in the market internals even for large caps spell possible trouble ahead.
An opinion of a self-proclaimed pundit wouldn't be complete if it didn't have some "historical perspective". I am here to offer two perspectives: 1998-2001 and 2006-2009, which are periods that include the latest two bear markets.
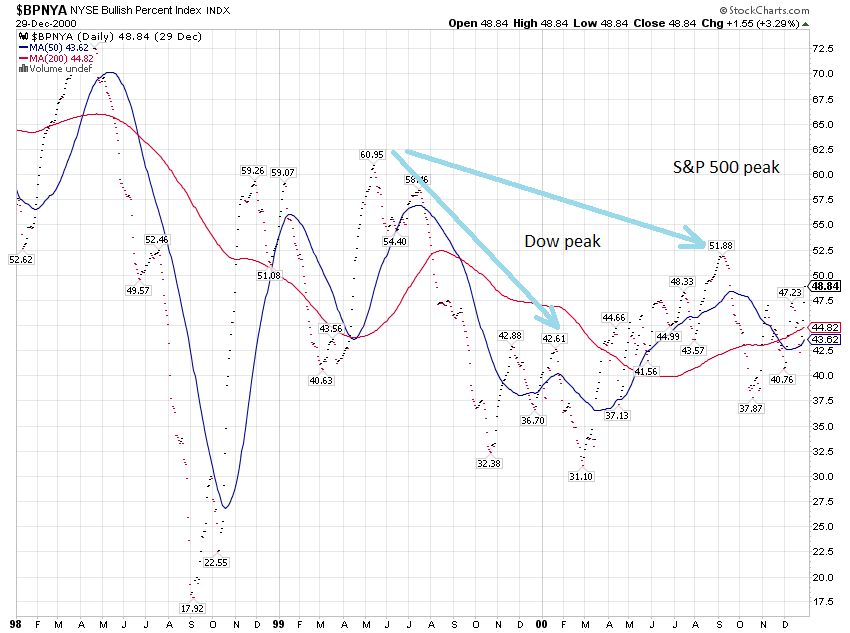
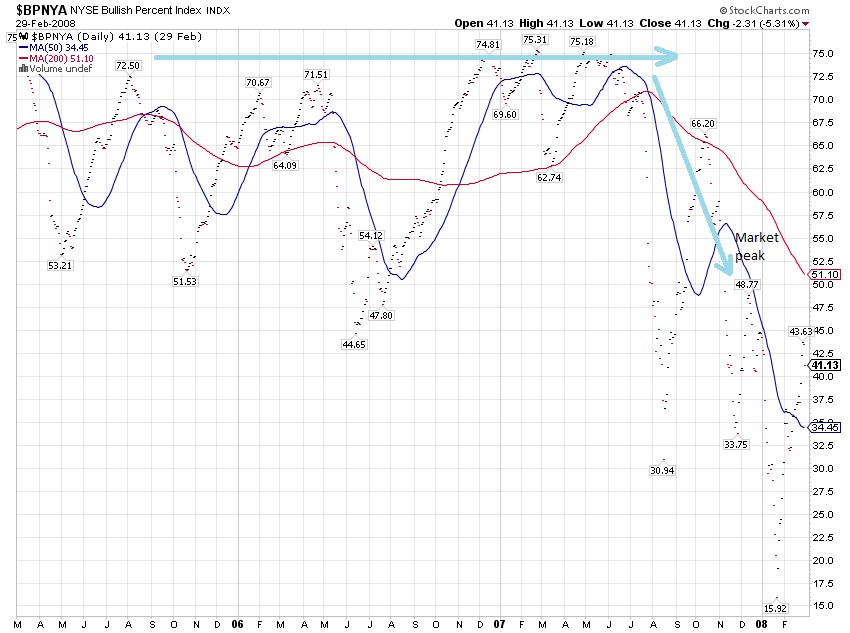
Both 2000 and 2007 peaks occurred when bullish percent indicators were around 50 and were trending lower for two-three quarters as the underlying indices were hitting all-time highs. This is exactly the situation we are witnessing at this time with the latest December peak in major US stock averages.
Now I have no idea what would be a trigger, an event, or a fundamental change in perspective that brings about a decline in stock prices, but I'm willing to sit on the sidelines and wait for it all to play out.
This article reflects my subjective opinion and take it with a grain of salt. Free advice is worth as much as you're paying for it.
Disclosure: The author has no positions in any stocks mentioned, and no plans to initiate any positions within the next 72 hours.

Investors crowd outperforming trades and stay out of problematic sectors. When crowds become too large at some point the outperforming sector starts bursting and investors sell, but they are not ready to buy underperforming sectors just yet, creating a temporary sell disbalance.
Markets are not as efficient as most academics would lead you to believe.