


正文
1. The sideway trading is getting closer and closer to a resolution. ES continues to trade mostly above flat PL. Indicators are still in bullish mode and daily remains its sideway/bullish pasture.
2. Today's trading showed the swing around a very tight rainbow band around 56-7 zone. The candles with long whiskers indicate indecision and 56-7 continues to serves as a magnet for 3 hour chart. Since the center line for daily is near 51-2 and 3-H is near 56-7, it suggests a bullish bias just based on this info alone. Indicators for 3H start to turn bullish. My guess is that the odd for a breakup is higher than that of a breakdown based on these two charts.
3. Short term RS Levels: 81, 75, 66-7, 62-3, 55-6, 51, 45.5 zone, 41-2, 34.5, 28, 23, 11.5
Daily
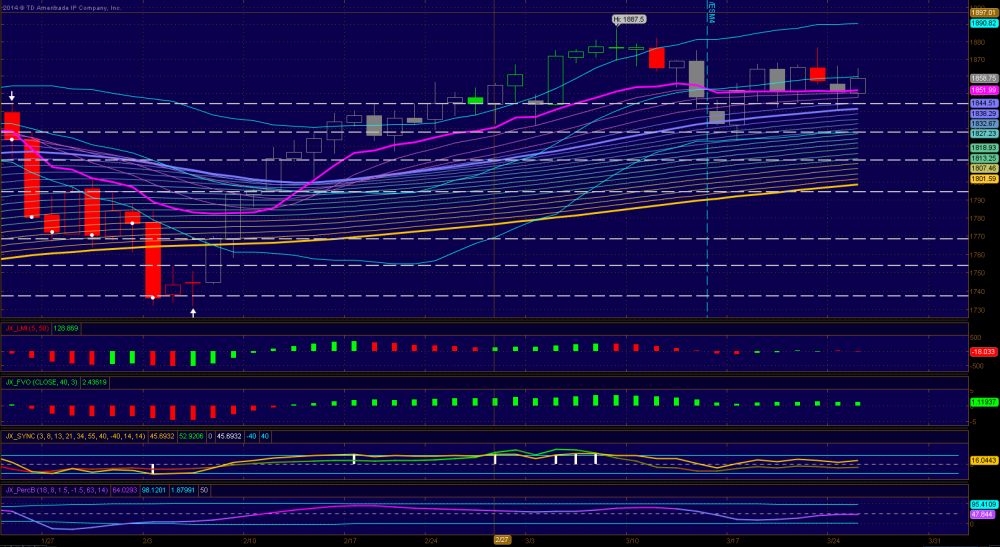
3-Hour

2. Today's trading showed the swing around a very tight rainbow band around 56-7 zone. The candles with long whiskers indicate indecision and 56-7 continues to serves as a magnet for 3 hour chart. Since the center line for daily is near 51-2 and 3-H is near 56-7, it suggests a bullish bias just based on this info alone. Indicators for 3H start to turn bullish. My guess is that the odd for a breakup is higher than that of a breakdown based on these two charts.
3. Short term RS Levels: 81, 75, 66-7, 62-3, 55-6, 51, 45.5 zone, 41-2, 34.5, 28, 23, 11.5
Daily
3-Hour

评论
CCCCCC2010
2014-03-25 16:30:52
回复
悄悄话
Thanks
登录后才可评论.