


正文
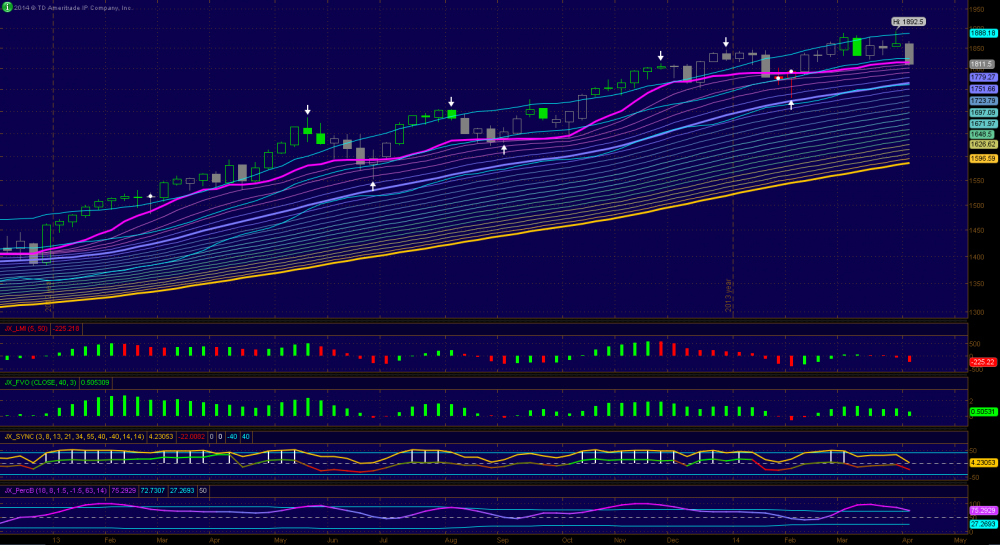
1. Weekly chart is still bullish and indicators are saying the same thing. ON weekly chart ES was very overbought when it made the new high and the latest weakness could be just a reaction to alleviate the over bought condition. Weekly close is just underneath PL and mid-trading band therefore nothing on the weekly chart have suggested a trend reversal. Only when ES is below 1760-50 zone that we can talk about the end of this bullish trend.
2. ES daily closed 11.5 sharp which speaks volume about the importance of this support. Since the TOL is also here I expect we should see a fight put up by bulls around 97-11.5. PL and TBL are about the same so we either have a crossover or bounce off here on Monday. Daily indicators are bearish and ES is in oversold zone now.
3. Indicators for 3-hour are also bearish and ES oversold. However there is a potential bullish divergence developing on 3-h frame and 11.5-97 zone will be a perfect place for a reversal. If it can only manage a small rebound instead that will not be good for bulls since it suggests lower price ahead.
4. 88.5, 81.5, 77, 74, 68.5, 64, 56, 44-5, 40, 31.5-33, 25.5, 11.5, 1797, 1771, 1754, 1732 and 1690.
Weekly
Daily

3-Hour

2. ES daily closed 11.5 sharp which speaks volume about the importance of this support. Since the TOL is also here I expect we should see a fight put up by bulls around 97-11.5. PL and TBL are about the same so we either have a crossover or bounce off here on Monday. Daily indicators are bearish and ES is in oversold zone now.
3. Indicators for 3-hour are also bearish and ES oversold. However there is a potential bullish divergence developing on 3-h frame and 11.5-97 zone will be a perfect place for a reversal. If it can only manage a small rebound instead that will not be good for bulls since it suggests lower price ahead.
4. 88.5, 81.5, 77, 74, 68.5, 64, 56, 44-5, 40, 31.5-33, 25.5, 11.5, 1797, 1771, 1754, 1732 and 1690.
Weekly
Daily
3-Hour

Take care!
Very nice to see rainbow again.