Trading for a Living
TBA.


正文
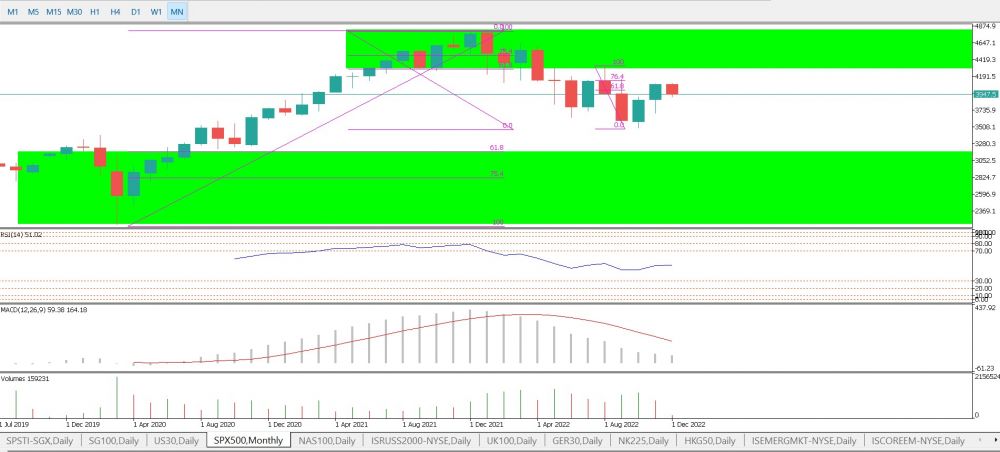
SPX500 Monthly Chart: Harami breakout, long upon daily chart being oversold.
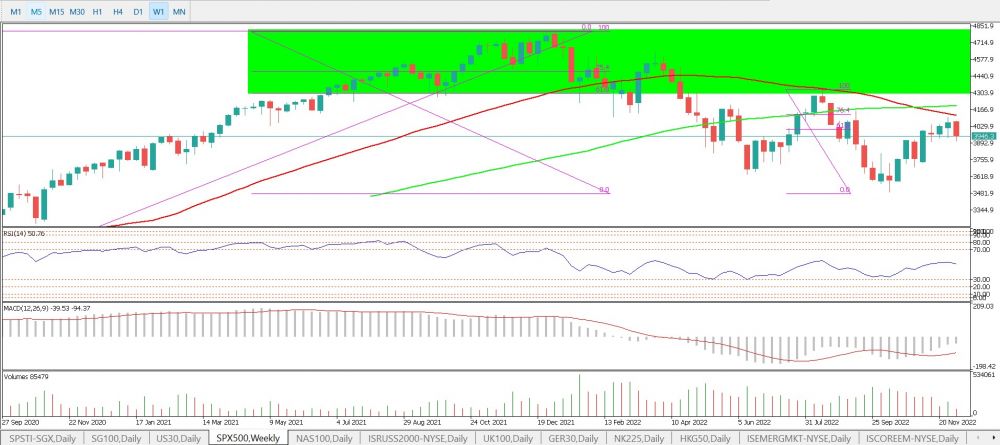
SPX500 Weekly Chart: Bullish engulfing, long upon 4 hour chart being oversold.
SPX500 Daily Chart: Inverse head & shoulders chart pattern breakout, currently triple retracements to neckline almost completed, accumulate at around support levels. Minimum technical target 4200 points.


评论
目前还没有任何评论
登录后才可评论.