炒股贻性

依据TA思维,观察记录每天股市走势,试图理解华尔街机构操控股市的套路,并且预测股市短期走势,在实践中检验个人预测的可靠性。从而不断地改进实际操作成功率。
个人资料
正文

关于 mu 今天的走势

(2017-12-21 11:43:53) 下一个


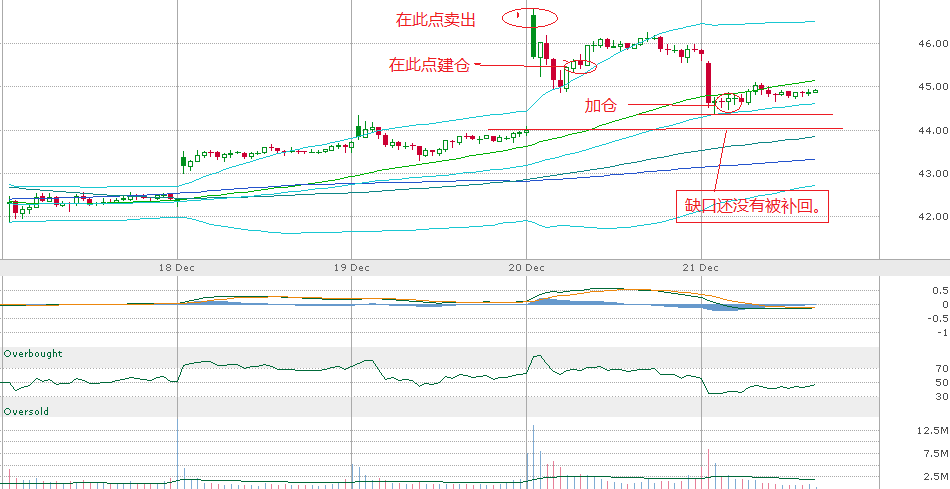
由于季报超出分析师预期20%,昨天mu高开,收盘保住了缺口,涨4%。今天几个semi的强势股,mu,amat,intc等均被大幅杀跌,soxx 几天来大幅上涨,今天回调一天,并没有破坏技术指标。mu盘中最深跌幅超过2.2%,但目前缺口仍然被完全补回(见下图)。TA指标指出,空头仍然没有占主导,现在就下结论mu已走熊还为时过早。

mu今年涨幅100%,原因并不是被炒起来,根本的原因是其坚实的FA(见下表)。mu下季的盈利预期超过分析师预期20%,mu已经连续五个季度超过分析师预期。坚实的FA是判断mu未来走势的唯一依据。

mu今天下跌的另一个可能的原因MM杀跌mu的股价是要杀本周到期大量call。本周到期的option 链,call的数量明显大于put。

个人看法,不作投资依据。


xx

2017  12 19 季报后修订

Earnings Estimate

Current Qtr. (Feb 2018)

Next Qtr. (May 2018)

Current Year (2018)

Next Year (2019)

No. of Analysts

25

25

27

24

Avg. Estimate

2.52

2.39

9.66

8.55

Low Estimate

1.83

1.68

7.74

5.05

High Estimate

2.64

2.83

10.66

11.77

Year Ago EPS

0.9

1.62

4.96

9.66


EPS Trend

Current Qtr. (Feb 2018)

Next Qtr. (May 2018)

Current Year (2018)

Next Year (2019)

Current Estimate

2.52

2.39

9.66

8.55

7 Days Ago

2

1.93

7.89

6.77

30 Days Ago

1.96

1.89

7.72

6.83

60 Days Ago

1.92

1.85

7.61

6.7

90 Days Ago

1.6

1.55

6.46

5.38

xx


MU


44.87


44.88


44.88


-0.87


-1.90


2900X2000


45.58


44.35


32,606,569


Thu Dec 21 2017 1:03:32 pm ET|https://invest.ameritrade.com/amer/images/icn_refreshBlue.gif


MU Dec 22 2017

1 Days to Expiration (Weeklys)


Expand Collapse


Calls Calculator


Bid


Ask


Last


Change


Vol


Op Int


43.5 Callhttps://invest.ameritrade.com/amer/images/optionchain/btn_QuoteMenu_Up.gif


1.36


1.50


1.43


-0.83


674


7,190


44.0 Callhttps://invest.ameritrade.com/amer/images/optionchain/btn_QuoteMenu_Up.gif


0.94


1.03


0.97


-0.86


4,524


16,968


44.5 Callhttps://invest.ameritrade.com/amer/images/optionchain/btn_QuoteMenu_Up.gif


0.57


0.61


0.60


-0.88


2,302


5,998


45.0 Callhttps://invest.ameritrade.com/amer/images/optionchain/btn_QuoteMenu_Up.gif


0.31


0.33


0.32


-0.63


13,422


17,067


45.5 Callhttps://invest.ameritrade.com/amer/images/optionchain/btn_QuoteMenu_Up.gif


0.13


0.16


0.13


-0.50


4,128


5,292


46.0 Callhttps://invest.ameritrade.com/amer/images/optionchain/btn_QuoteMenu_Up.gif


0.06


0.09


0.07


-0.32


5,443


13,533


Strike

43.50

44.00

44.50

45.00

45.50

46.00


Puts Calculator


Bid


Ask


Last


Change


Vol


Op Int


43.5 Puthttps://invest.ameritrade.com/amer/images/optionchain/btn_QuoteMenu_Up.gif


0.04


0.05


0.05


0.00


1,326


3,392


44.0 Puthttps://invest.ameritrade.com/amer/images/optionchain/btn_QuoteMenu_Up.gif


0.09


0.10


0.10


0.04


3,150


8,149


44.5 Puthttps://invest.ameritrade.com/amer/images/optionchain/btn_QuoteMenu_Up.gif


0.22


0.23


0.23


0.13


998


2,194


45.0 Puthttps://invest.ameritrade.com/amer/images/optionchain/btn_QuoteMenu_Up.gif


0.42


0.45


0.43


0.22


1,286


6,296


45.5 Puthttps://invest.ameritrade.com/amer/images/optionchain/btn_QuoteMenu_Up.gif


0.71


0.82


0.75


0.37


454


2,263


46.0 Puthttps://invest.ameritrade.com/amer/images/optionchain/btn_QuoteMenu_Up.gif


1.12


1.24


1.16


0.53


467


6,598


MU Dec 29 2017

8 Days to Expiration (Weeklys)


Expand Collapse


Calls Calculator


Bid


Ask


Last


Change


Vol


Op Int


43.5 Callhttps://invest.ameritrade.com/amer/images/optionchain/btn_QuoteMenu_Up.gif


1.73


1.86


1.75


-0.81


164


992


44.0 Callhttps://invest.ameritrade.com/amer/images/optionchain/btn_QuoteMenu_Up.gif


1.39


1.48


1.53


-0.67


548


2,838


44.5 Callhttps://invest.ameritrade.com/amer/images/optionchain/btn_QuoteMenu_Up.gif


1.10


1.12


1.11


-0.73


1,704


1,378


45.0 Callhttps://invest.ameritrade.com/amer/images/optionchain/btn_QuoteMenu_Up.gif


0.84


0.85


0.84


-0.61


2,332


4,499


45.5 Callhttps://invest.ameritrade.com/amer/images/optionchain/btn_QuoteMenu_Up.gif


0.62


0.65


0.58


-0.61


1,426


3,525


46.0 Callhttps://invest.ameritrade.com/amer/images/optionchain/btn_QuoteMenu_Up.gif


0.44


0.46


0.44


-0.47


3,460


7,266


Strike

43.50

44.00

44.50

45.00

45.50

46.00


Puts Calculator


Bid


Ask


Last


Change


Vol


Op Int


43.5 Puthttps://invest.ameritrade.com/amer/images/optionchain/btn_QuoteMenu_Up.gif


0.36


0.40


0.41


0.12


383


888


44.0 Puthttps://invest.ameritrade.com/amer/images/optionchain/btn_QuoteMenu_Up.gif


0.50


0.52


0.51


0.13


767


1,294


44.5 Puthttps://invest.ameritrade.com/amer/images/optionchain/btn_QuoteMenu_Up.gif


0.68


0.70


0.71


0.21


362


1,064


45.0 Puthttps://invest.ameritrade.com/amer/images/optionchain/btn_QuoteMenu_Up.gif


0.92


0.97


0.95


0.33


355


1,683


45.5 Puthttps://invest.ameritrade.com/amer/images/optionchain/btn_QuoteMenu_Up.gif


1.20


1.22


1.26


0.42


43


761


46.0 Puthttps://invest.ameritrade.com/amer/images/optionchain/btn_QuoteMenu_Up.gif


1.51


1.61


1.58


0.50


211


857


Color indicates options that are in-the-money https://invest.ameritrade.com/amer/images/icn_NS.gifIndicates non-standard option


xx


[ 打印 ]
阅读 ()评论 (0)
评论
目前还没有任何评论
登录后才可评论.