


正文
1. Daily is close to make a new high and the upper band resistance. Price is approaching overbought zone. Perhaps some consolidation action is near since ES has made a nice move 4 days in a row.
2. 3-Hour chart shows the upwards momentum is slowing and price is hugging the upper band.
3. RS Levels: 88, 81, 78, 75, 68, 62.5, 58.75, 51-2, 48
Daily

3-Hour
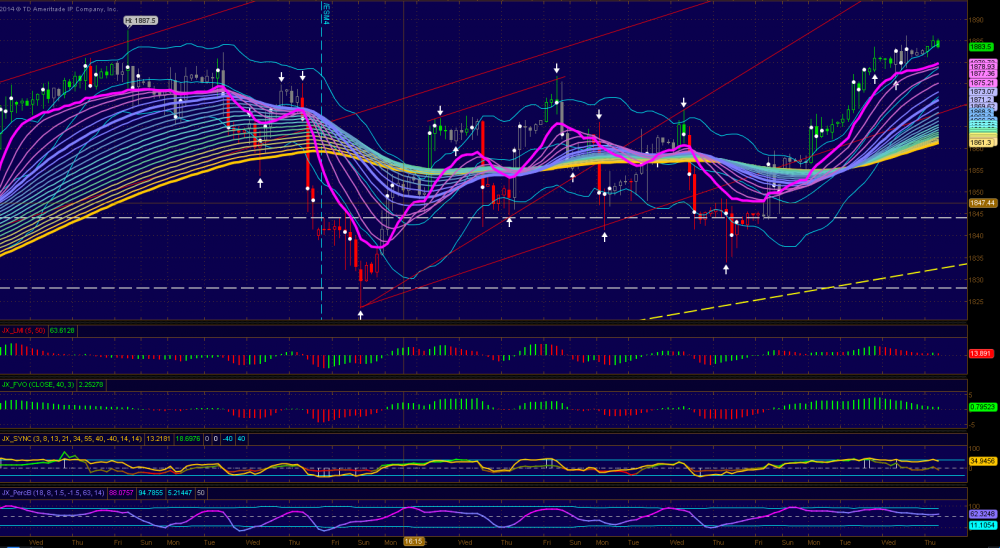
2. 3-Hour chart shows the upwards momentum is slowing and price is hugging the upper band.
3. RS Levels: 88, 81, 78, 75, 68, 62.5, 58.75, 51-2, 48
Daily
3-Hour

评论
georgeyn
2014-04-03 06:24:04
回复
悄悄话
thanks for your hard work
CCCCCC2010
2014-04-03 06:20:37
回复
悄悄话
Thanks
登录后才可评论.