


正文
Note: Please ignore the last unfinished bar.
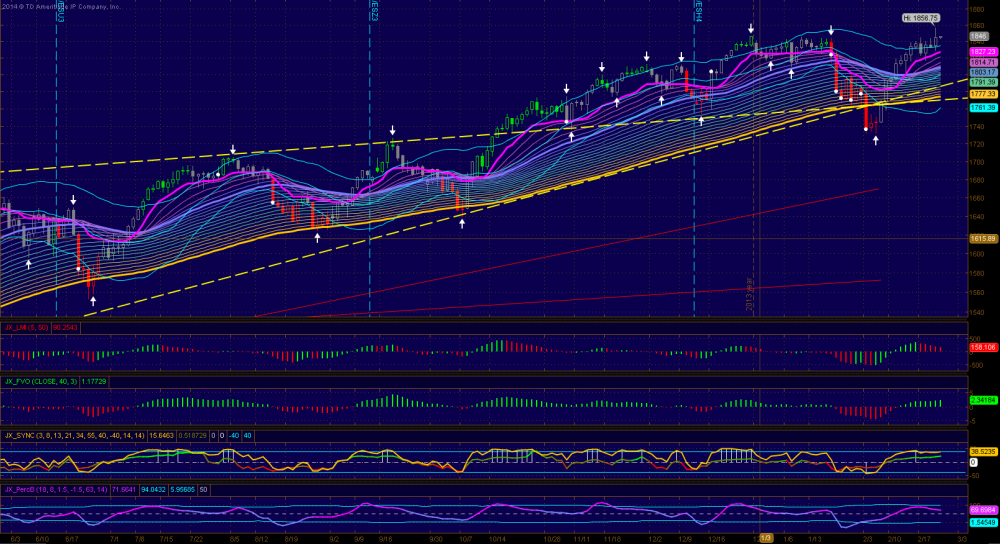
The weakness on last week's 3-h chart was short lived and ES rebounded during ON and lead to a nice day for bulls. However the close was a bit of letdown giving back about 1/2 of the morning gain. Still an all time high with close above the pinky line strengthened the bullish scenario. Rising pinky and expanding rainbow agreed with bullish indicators implied higher price near term. Pinky for daily and 3-hour are near 23 and 41 which corresponding to two of R/S levels and will be the levels to watch. ES closed at another R/S level 44.5 which we are very familiar by now.
The retest of previous high (46 to 44) is normal after a breakout and charts look good for further upside movement near term.
R/S levels: We have a few more resistances now around 48, 51-2 and 55. Supports: see yesterday's R/S levels
Daily
3-hour

评论
ah39
2014-02-25 06:23:51
回复
悄悄话
Thanks always!
9368
2014-02-24 20:17:52
回复
悄悄话
Thanks!
Amber.
2014-02-24 19:47:48
回复
悄悄话
谢谢分享。读你的博文是每天的功课。
我欲因之
2014-02-24 18:53:01
回复
悄悄话
Thanks, bro.
登录后才可评论.