


正文
Note:
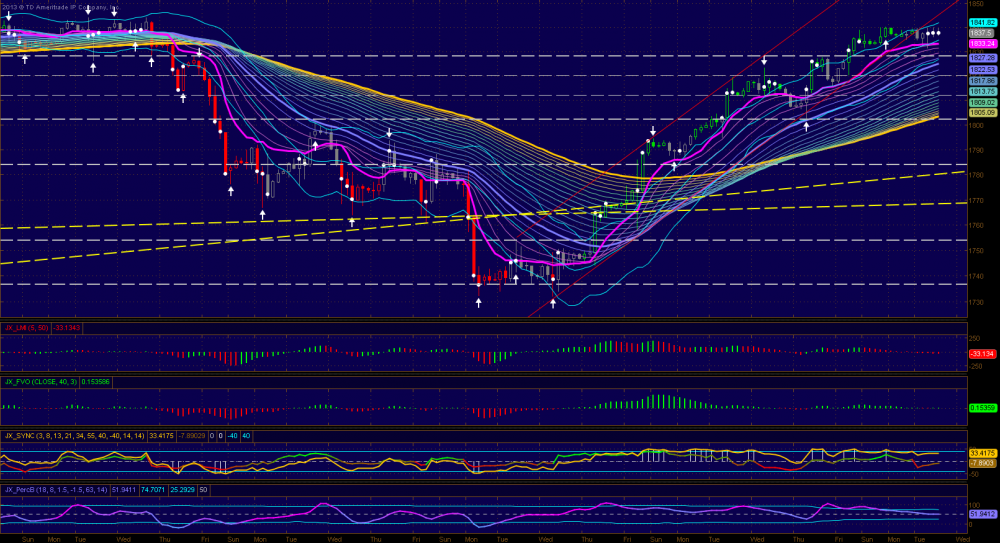
- ES literally traded sideway today and the daily closed above the upper trading band with a SYNC stick on a grey candle with decreased momentum (LMI). Normally when SYNC sticks come early in a breakout which demonstrate the strength of the breakout often on a wide range bar with green or red. However the current stick arrives late and on a grey candle. This could happen near a top of a range market which is what the weekly chart suggested. Unless tomorrow's FOMC statement can produce a wide range green candle with a SYNC stick (new high), I expect some downside pressure short term. ES has been trendless on lower time frame and is ready for a strong trend either way and tomorrow is the perfect time to so that.
- At the same time indicators for daily are still bullish except momentum starting to decline which is to be expected after the recent strong move. So the overall is still bullish with possible ST weakness.
- The 3h chart showed the sideway action (31-41) mentioned above and pinky is flat and indicators are neutral. The up channel has been violated today. Breaking out of the consolidation should be the near term direction. However it will be very tricky to determine the real direction tomorrow due to the expected wide swing after FOMC statement. We should have a good idea after the initial wild swings.
- Supports: (34), (31), 28, (23), 18-9, 11, 03, 95, and 85; Resistances: 38, 41 and 44-5.
Daily Chart

3-Hour Chart

评论
回乡偶书
2014-02-18 21:30:36
回复
悄悄话
老大,谢谢你!
登录后才可评论.