


正文
Note:
1. The weekly is saying correction is likely over if we don't get more weekly close below 1790. If ES could start printing weekly green candles, the chance of 1900 is very good.
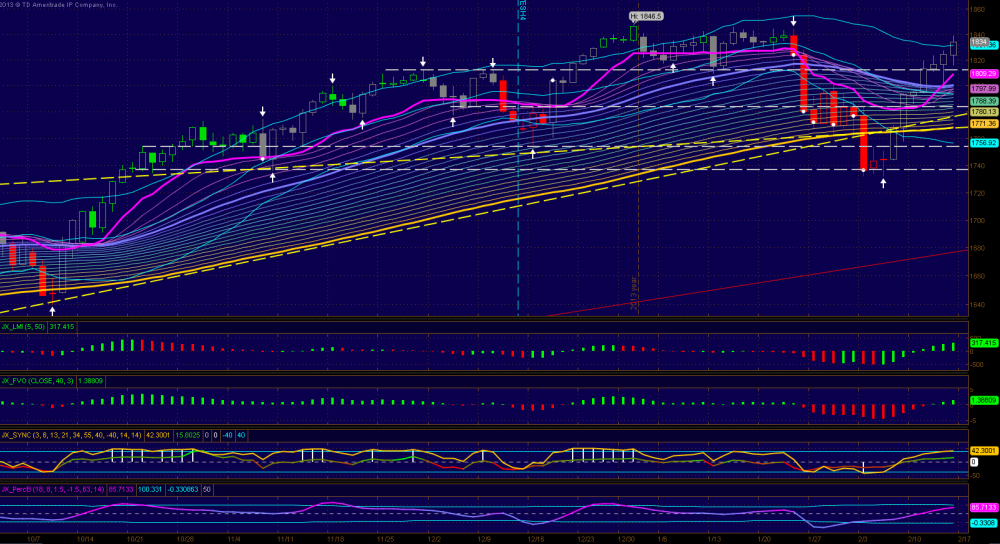
2. Daily chart has managed a close above the upper trading band and closed above the 31.25 resistance. Indicators are all bullish and trading action above 1800 is bullish and below 1770 is good for a bearish scenario.
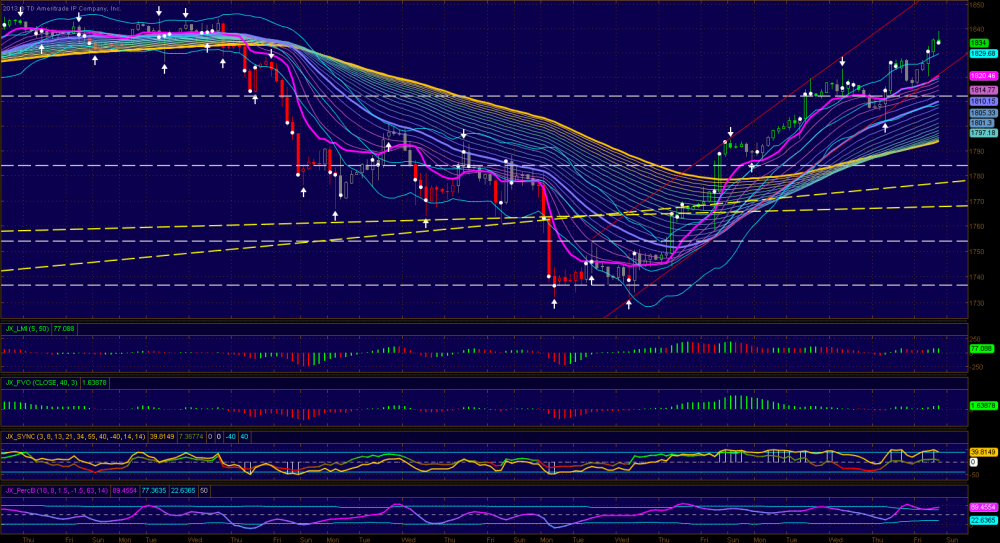
3. The 3h chart is also in good shape after breaking through the 31.25 resistance. I forgot to list 37-8 old resistance in Thursday note. Anyway it touched it again and closed at our old friend 34-5 level.
Supports: 31, 28, 23, 17, 11 and anything below 11 will not be good for a bullish scenario especially under 1899-1790
Resistance: 37-8, (41), & 44-5.
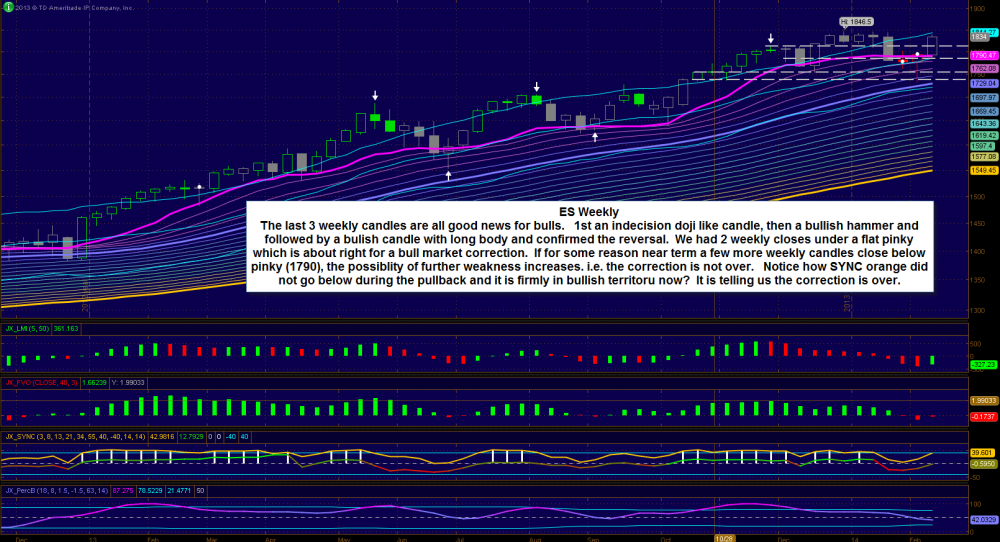
1. The weekly is saying correction is likely over if we don't get more weekly close below 1790. If ES could start printing weekly green candles, the chance of 1900 is very good.
2. Daily chart has managed a close above the upper trading band and closed above the 31.25 resistance. Indicators are all bullish and trading action above 1800 is bullish and below 1770 is good for a bearish scenario.
3. The 3h chart is also in good shape after breaking through the 31.25 resistance. I forgot to list 37-8 old resistance in Thursday note. Anyway it touched it again and closed at our old friend 34-5 level.
Supports: 31, 28, 23, 17, 11 and anything below 11 will not be good for a bullish scenario especially under 1899-1790
Resistance: 37-8, (41), & 44-5.

评论
Ophelia
2014-02-17 09:25:52
回复
悄悄话
thanks!!!
连山
2014-02-16 20:14:59
回复
悄悄话
Thanks
9368
2014-02-16 13:29:14
回复
悄悄话
Thanks
CCCCCC2010
2014-02-16 04:18:15
回复
悄悄话
Thanks
登录后才可评论.