


正文
Due to repeatitive request from some DQers, I have decided to post my daily chart in my blog instead of in group from now on. Hopefully more people can view it and benefit from my analysis.
Good Luck all~
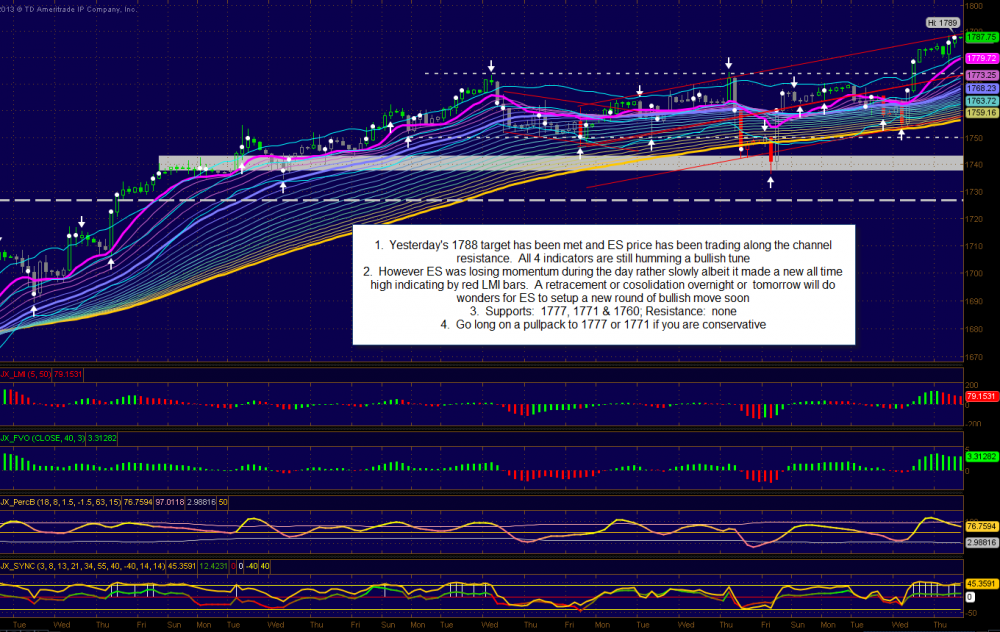
1788 一起发发 has been done now. let's see if we could do a 1888!
Note about my indicators:
LMI: Leading Momentum Indicator-leads the price action ingeneral. Green: momentum is increasing..red decreasing. >0 bullish <0 bearish
FVO: Fair value Oscillator, green >0 bullish; red < 0 bearish
PercB: a leading Overbough/Oversold indicator. Above upper band overbough, below oversold. Since it leads price, a cross back of the top/bottom from overbough/sold condition signal change
SYNC: An oscillator with a twist. Orange >50 bullish; < 50 bearish. If the variable color line (green/red) crossed 50 ahead of the orange line.. the following move is suspious (bear market rally or bull market retracement). A trend signal is consider reliable only when Orange line crossed 50 first. In addition a bar will appear when short, mid or long term cycle indicator are in sync (up or down simultaneously). A breakout with many sync bars are a strong one and unlike to be a false breakout.
Rainbow: a groupd of MAs. When rainbow is expanding .. market is trening! when rainbow is rolling over.. trend is changing direction. When pink line "pinky" is flat the market is in a trading range (TR),
Good Luck all~
1788 一起发发 has been done now. let's see if we could do a 1888!
Note about my indicators:
LMI: Leading Momentum Indicator-leads the price action ingeneral. Green: momentum is increasing..red decreasing. >0 bullish <0 bearish
FVO: Fair value Oscillator, green >0 bullish; red < 0 bearish
PercB: a leading Overbough/Oversold indicator. Above upper band overbough, below oversold. Since it leads price, a cross back of the top/bottom from overbough/sold condition signal change
SYNC: An oscillator with a twist. Orange >50 bullish; < 50 bearish. If the variable color line (green/red) crossed 50 ahead of the orange line.. the following move is suspious (bear market rally or bull market retracement). A trend signal is consider reliable only when Orange line crossed 50 first. In addition a bar will appear when short, mid or long term cycle indicator are in sync (up or down simultaneously). A breakout with many sync bars are a strong one and unlike to be a false breakout.
Rainbow: a groupd of MAs. When rainbow is expanding .. market is trening! when rainbow is rolling over.. trend is changing direction. When pink line "pinky" is flat the market is in a trading range (TR),

评论
回乡偶书
2013-11-17 17:23:52
回复
悄悄话
谢谢TA老大!
ah39
2013-11-14 14:40:19
回复
悄悄话
宽频贴这样的图很好。谢谢你的五彩图。真正想看的人会到你的博客来。自己也可以留个备份。
登录后才可评论.