菜鸟学习中
菜鸟学习中


正文
- CNN Fear & Greed Index: Contrarian Signal
- AAII Investor Sentiment: Contrarian Signal
- SPX PCR: Contrarian Signal
- SPX IV PCR (Contrarian Signal) and Option Chain
- VIX: Contrarian Signal, Spike > 20% above 10-day MA Possible bottom
- %>20MA: >80 overbought (“escape velocity”), LT 20 oversold, LT 10 panic rare, 50-80 bullish trend, 20-50 choppy
- McClellan Oscillator: overbought, oversold, divergence, zeroline crossing. (Many more Market Breadth indicators on this site)
- McClellan Volume Oscillator: Money in, Money out, divergence
- BPI and P&F of NYSE, with commentary
- BPI of S&P 500
- SPY P&F
- BPI of NASDAQ
- QQQ P&F
- Polymarket ...Economy: recession, inflation, Fed decision odds
- Kalshi: Financial market odds
- Yield Curve (10Y - 2Y) Inversion = Recession signal
- 10-Year - 3-Month Treasury spread
- BofA Merrill Lynch US High Yield OAS
- BofA Merrill Lynch US Corporate Master OAS
- Fed Economic Data WSJ Market Data Center
- FNGS adjust its holdings following last Friday of each quarter based on the NYSE FANG+? Index
- FNGS adjust its holdings following last Friday of each quarter based on the NYSE FANG+? Index
- Short Interest VIX PCR TLT Price
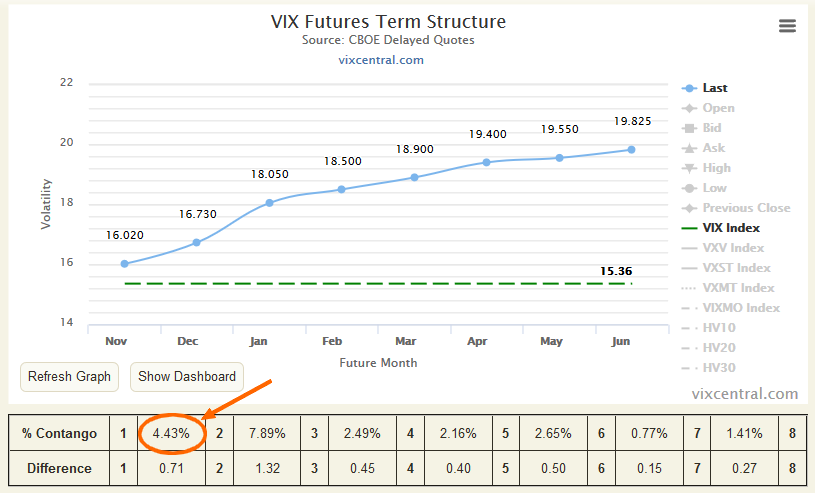
- SVXY real time Typical VIX term structure VIX term structure SVXY daily holdings VIX3M(onths)
- Is this week OE week (3rd Friday for monthly cycles)?
- Is this week SPY dividend week (ex-dividend = 3rd Fri of last month of the quarter)?
- CNBC Finance News market insider with Patti Domm.
- Sector|Industry performance, and Fidelity research pdfs
- Quick search for current junk-bond default rate Junk-bond default rate 1982 - 2016
- Investing.com
- Google Finance
- Yahoo Finance
- dataroma.com
BPI < 30 → overweight equities (especially on reversal)
BPI 30–70 → normal allocation
BPI > 70 → underweight or hedge (especially on reversal)
Open a chart tool, check for CCI, RSI, BPI, observe patterns: Elliott Wave, Head and shoulders, double tops/bottoms, triangles – all used to predict reversals or continuations.


评论
目前还没有任何评论
登录后才可评论.