亦诗的博客
Nothing Now


正文
The past few years have proven that the world economy lives and dies on the success of major financial markets around the world.
Traders use sophisticated software to analyze trends, make predictions and purchases. There is one legendary trader, who made billions of dollars analyzing market trends.
His name was Munehisa Homma and the only thing he traded was rice. His billions in earnings are in today’s dollars and he may have known more about market analysis in the 1700s than our smartest people do now.
He began trading rice in Osaka, where the rice market was very sophisticated, it even traded rice futures. Coupons were sold that promised the delivery of rice at a specific price in the future. Homma was believed to have created a personal network of 100 men located about 6km apart from each other to move market information between Osaka and Sakata.
He wrote the first book on market psychology in 1755, The fountain of Gold – The Three Monkey Record of Money. I have no idea what the title means, hopefully somebody is working on a movie adaptation and we can see it in 3D. Maybe it could be a prequel to 12 Monkeys?
Seriously though, Homma was a genius. He invented the candlestick chart, which is still used by traders today.
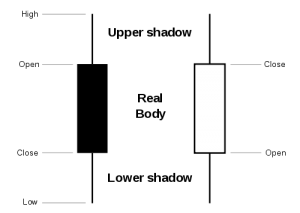
This handy chart combines four pieces of data into each plot point on a date axis. For example, you can look at a single day of trading of a specific stock and see the open and close price of the stock on that day (the candle body), along with a low and high range of prices at which it traded throughout the day (the candle wick). The candle body is solid when the open price is represented by the top line and the close price is the bottom line. It is hollow when it’s the opposite, indicating whether the price increased or decreased that day.
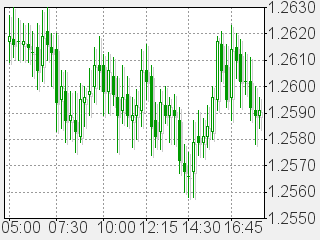
For a single date, this gives the reader a lot of information. But, it becomes a fountain of gold when you put multiple days together — that’s when patterns can be spotted. The great master could read the chart and predict how the market would behave in the future. Understanding these patterns is how he made his billions.
Charles Dow recognized the value of candlestick charts around 1900 and included them in his studies. You may have heard of him, he’s the guy who co-founded Dow Jones & Company, The Dow Jones Industrial Average and The Wall Street Journal.
He was obviously a brilliant man, but it was the research of Steve Nison in the early 1990s that popularized candlestick charts in North America. If you want to know more about these charts, you should look at his work.
Homma is still recognized as the greatest trader of all time. It is believed that he made more than $100 billion (today’s dollars). He once said, when all are bearish, there is cause for prices to rise.
(ZT)
Traders use sophisticated software to analyze trends, make predictions and purchases. There is one legendary trader, who made billions of dollars analyzing market trends.
His name was Munehisa Homma and the only thing he traded was rice. His billions in earnings are in today’s dollars and he may have known more about market analysis in the 1700s than our smartest people do now.
He began trading rice in Osaka, where the rice market was very sophisticated, it even traded rice futures. Coupons were sold that promised the delivery of rice at a specific price in the future. Homma was believed to have created a personal network of 100 men located about 6km apart from each other to move market information between Osaka and Sakata.
He wrote the first book on market psychology in 1755, The fountain of Gold – The Three Monkey Record of Money. I have no idea what the title means, hopefully somebody is working on a movie adaptation and we can see it in 3D. Maybe it could be a prequel to 12 Monkeys?
Seriously though, Homma was a genius. He invented the candlestick chart, which is still used by traders today.
This handy chart combines four pieces of data into each plot point on a date axis. For example, you can look at a single day of trading of a specific stock and see the open and close price of the stock on that day (the candle body), along with a low and high range of prices at which it traded throughout the day (the candle wick). The candle body is solid when the open price is represented by the top line and the close price is the bottom line. It is hollow when it’s the opposite, indicating whether the price increased or decreased that day.
For a single date, this gives the reader a lot of information. But, it becomes a fountain of gold when you put multiple days together — that’s when patterns can be spotted. The great master could read the chart and predict how the market would behave in the future. Understanding these patterns is how he made his billions.
Charles Dow recognized the value of candlestick charts around 1900 and included them in his studies. You may have heard of him, he’s the guy who co-founded Dow Jones & Company, The Dow Jones Industrial Average and The Wall Street Journal.
He was obviously a brilliant man, but it was the research of Steve Nison in the early 1990s that popularized candlestick charts in North America. If you want to know more about these charts, you should look at his work.
Homma is still recognized as the greatest trader of all time. It is believed that he made more than $100 billion (today’s dollars). He once said, when all are bearish, there is cause for prices to rise.
(ZT)

评论
目前还没有任何评论
登录后才可评论.