


At this point, the market (S&P 500 (SPY)) is down roughly 0.50% and we are already getting memos to buy this dip. However, the problem is: this is no dip and if we start changing definitions, you might as well buy every single downtick.
In this article, I will explain why you will get a real opportunity to buy stocks a bit cheaper in this uptrend without the need to panic (as some people tend to do when the markets does not reach a new high every few hours).

Source: Interactive Brokers Commercial
Gundlach Was Right
Famous hedge fund manager Jeffrey Gundlach warned about junk bond weakness and the effects on the stock market. He noticed a divergence between these high yield corporate bonds and the market which is always a warning signal.
"JNK ETF down six days in a row, closing near its seven month low," the DoubleLine Capital LP co-founder wrote on Twitter Wednesday. "SPX up five of last six days, closing at an all time high. Which is right?"
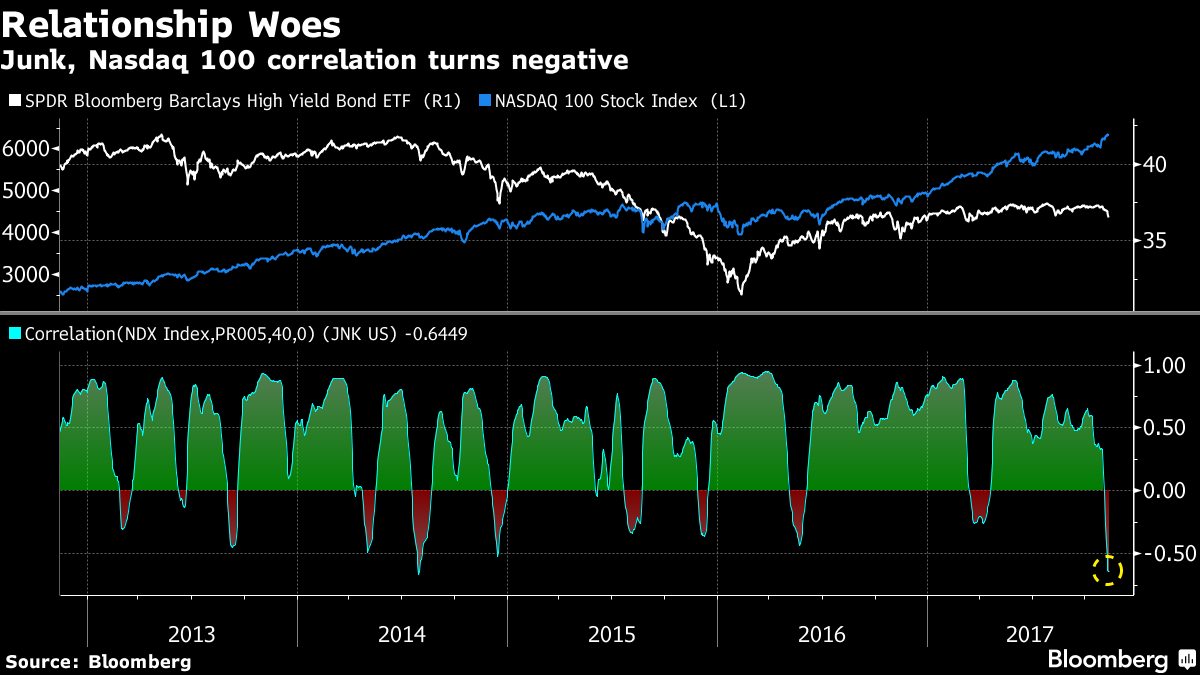
Junk bonds are a very valid warning indicator and I advise everyone to monitor these bonds. However, they are only a smaller part of the big picture.
This Model Could Not Have Worked Any Better
The cornerstone of my market outlook is mostly based on leading indicators like the ISM manufacturing index. This indicator tells us how the US economy is performing. Values above 50 indicate economic expansion while values below 50 indicate the very opposite. That being said, there is no denying that the correlation is anything less than significant. The ISM index has guided stocks higher since the first quarter of 2016.
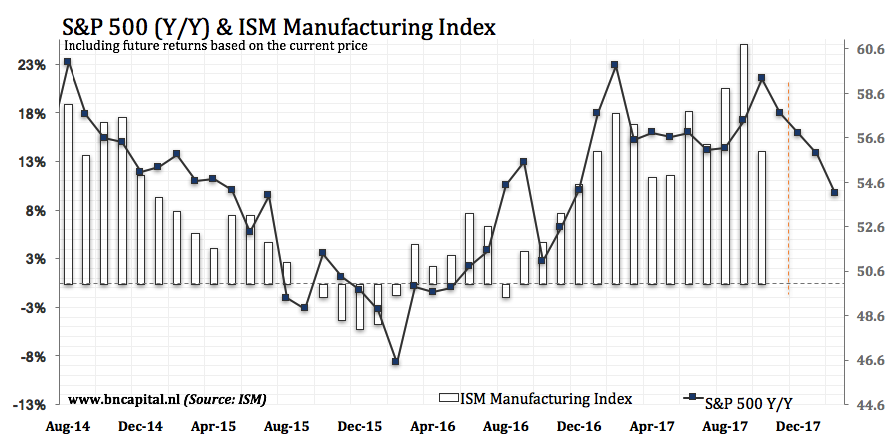
And I have to admit that I had some doubts whether the correlation would stay high once the ISM index went above 57. However, stocks kept rallying without any corrections or even bigger dips.
Moreover, based on the most recent ISM dip to 56, I am moving my S&P 500 target to 2,700 by the first quarter of 2018 instead of the fourth quarter of this year.
At this point, we are likely to get an opportunity to buy stocks in a dip and here is why:
This Time It's Not Different
I am going to continue talking about the ISM manufacturing index because the next graph adds value after seeing the graph above. What you see below is the comparison between the S&P 500 and the ISM index. I also added the RSI to indicate overbought and oversold situations. What we see is that an ISM acceleration to the upside causes stocks to stay overbought for an extended period. ISM slowing on the other hand provides interesting entries.

Source: Tradingview
Note that I look at the 40-60 levels instead of the usual 30-70. You usually do not get to buy stocks or indices in an uptrend below the RSI 30 level. These sell-offs are often indicating that there is something wrong and a quick recovery is almost never the case in these situations.
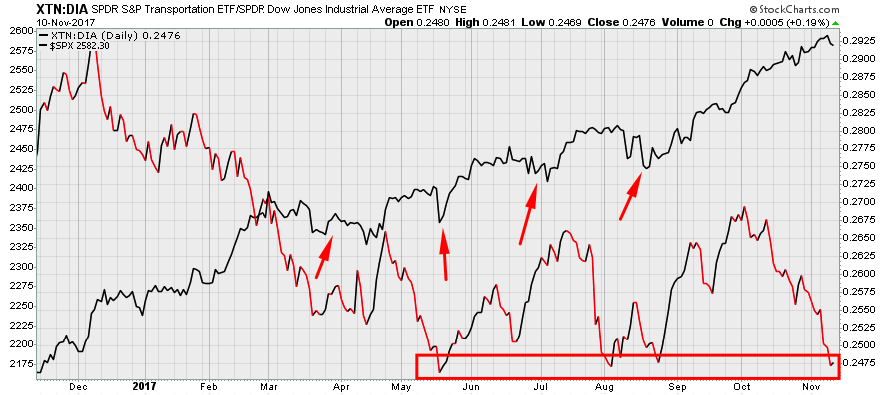
Also, let's move over to another graph I frequently use. It shows the ratio spread between transportation stocks and the Dow Jones Industrial Average. I also added the S&P 500 because this is a sentiment indicators that compares highly cyclical assets to less cyclical assets and can therefore be considered to be an indicator of the willingness to take risk.
The pattern is similar. The ratio has fallen back to 0.247 for the fourth time since May of 2017. Even though this is one of many sentiment indicators, it is clear that every drop has caused the S&P 500 to show some weakness. A 2% drop would be very healthy and it would not in any way harm the long term uptrend.
Speaking of signals, only 71% of all S&P 500 stocks are currently showing bullish signals (BPSPX indicator) while only 63% of S&P 500 stocks are above their 50-day moving average (SPXA50R). This shows that underlying strength has already started to weaken.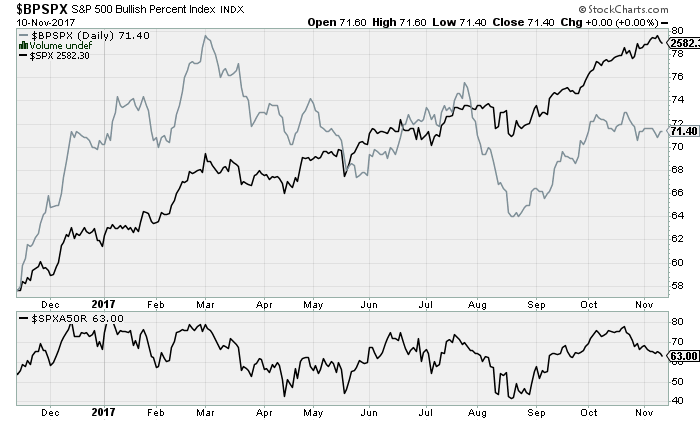
Gameplan
I have been a bull for quite some time and believe that 2700 is a valid target for the first quarter of 2018 under the current circumstances of above-average economic growth.
That being said, Gundlach is right when he calls junk bonds a warning indicator. There are signs that the market is going to show some weakness. And by weakness, I mean a dip of 2-3%.
Sentiment, market breadth, and economic growth are indicating that this long time bull market is going to allow people to buy dips again. This has happened before and is nothing to be worried about. I am therefore not calling to short this market but to use a dip to add to long positions.
Thank you for reading my article. Please let me know what you think of my thesis. Your input is highly appreciated!
Disclosure: I/we have no positions in any stocks mentioned, and no plans to initiate any positions within the next 72 hours.
I wrote this article myself, and it expresses my own opinions. I am not receiving compensation for it (other than from Seeking Alpha). I have no business relationship with any company whose stock is mentioned in this article.
Additional disclosure: This article serves the sole purpose of adding value to the research process. Always take care of your own risk management and asset allocation.

What about his bearish call and put buying? Did everybody forget already?