笨狼发牢骚
发发牢骚,解解闷,消消愁


这一来李克强那壮士断腕的改革决心就,就给搁置起来了。俗话说“短疼不如长疼”,习近平宁愿退几步也得把局面稳住,也许他觉得还有第二届的时间,大权在手就有机会。一季几万亿一砸。经济下行加剧的趋势就给扭转过来了。这胡温庸政,在一季还颇见成效。
法兴姚炜
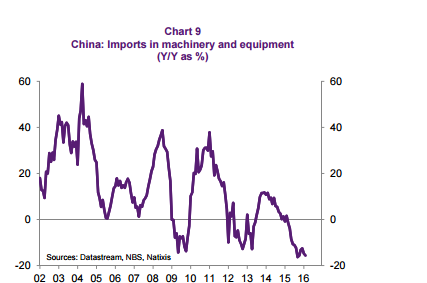
经济复苏的主要动力就来自于信贷扩张:其中三月信贷同比增速为15.8%,创下近20个月峰值。一季度信贷扩张达则到了7.5万亿人民币,同比激增58%,占比名义GDP46.5%的水平为历史之最。
法兴进一步指数,1-3月信贷扩张历史罕见说明政府对于一季度的经济增长十分重视。但是能否保持这种刺激方式却存在疑问。在房价飙升的环境下,资产泡沫迹象已经出现。如果信贷持续扩张的话,很有可能带来更多的风险,包括资本外流加剧和货币贬值。
瑞银汪涛
未来三种可能的演变结果。
在最理想的状况下,中国可能大体解决现有债务问题,就和十年前的结果类似。这需要政府持续信贷扩张和财政刺激的同时进行结构性改革,从而帮助负债率较低的行业和新兴行业拉起经济增长。全球需求复苏也是不可或缺的重要一环。
比较现实的结果是,中国可能无法等到全球经济需求和增速的复苏。政府将被迫在稳增长和控制信贷增长之间做出平衡,逐渐进行债务减记/重组并关闭僵尸企业。这种情况下,短期的经济增速将会放缓,但是长期的经济活力将得到保留。
最糟糕的一种情况就是中国政府改革步伐缓慢,过多的依赖杠杆因素。这样虽然短期的经济可能维持强劲,但是债务问题会不断恶化。看起来靓丽的数据很有可能掩盖实际问题,导致更多的资源被投向低效率甚至是无效率的行业。随着资产价格修正的到来,银行可用流动性将逐渐消逝,在加上过早的开放资本项,整个金融体系很有可能难以抵挡系统性问题的冲击。即便中国固有的特色可能不会令传统意义上的银行危机出现,但是产能出清和解决坏债的步伐必然会受到严重拖累。
(下略)
法国农贸银行
财政和货币刺激是中国短期经济反弹的主要动力。这种刺激在一段时间内依然可以延续,但是并不会带来中期结构性的复苏。在国企就业问题上的举棋不定、政府开支和信贷对传统行业的支持有限意味着中国的经济转型道阻且长。


2016年04月10日
如果说历史是任人打扮的小姑娘,那么,统计数据也可以用来粉饰业绩。不仅中国如此,国外也一样。不过,无论如何粉饰,都经不起推敲。一旦不真实,是可以被发现的,因为数据之间存在彼此的勾稽关系。鉴于最近大家对中国经济是否见底争议颇大,笔者不妨通过对统计数据的深度剖析来揭示GDP背后中国经济的真实状况。
2015年GDP增速只有5%吗
不少很资深的国内经济学家,也对GDP数据产生怀疑,认为去年6.9%的GDP增速是虚假的。海外的舆论更是对中国的GDP提出质疑,或许是因为2015年进口额下降了13.2%,表明内需大幅下降。不过,GDP所覆盖的经济指标实在太广了,不能仅就一两项指标来“略见一斑”。但统计部门需要反思的是,为何大家总不相信统计数据。不过,本人认为,仅就GDP这一个数据而言还是比较接近现实的。
仍以中国进口贸易为例,之所以进口额大幅下降,与中国进口商品的结构有关。中国已经是全球制造业的第一大国,故进口的多以大宗商品为主,如铁矿石、原油等,这些大宗商品的价格在2015年下降幅度甚至超过20%,即便进口量没有下降,价格因素也会导致进口额的大幅下降。
目前,中国在全球大宗商品消费市场份额:水泥、猪肉、镍、煤炭、钢铁、铝、铜、铅都超过40%,因此,如果只统计第一、第二产业的GDP,则中国的GDP也明显超过美国而成为全球老大。中美之间的GDP差距实际是在第三产业,中国第三产业的占比在2015年首次超过50%,但美国却要占到80%左右。
因此,大家在评估中国GDP增速的时候,往往只关注实体经济的状况,如企业的盈利状况,包括经济学家们也是如此。这也不奇怪,术业有专攻,经济学家们不太研究众多统计数据之间的关系和结构。如果只统计第一、第二产业GDP之和的增速,按我的估算,中国2015年的GDP增速为5.6%,确实与大家的判断比较接近。
但大家的习惯总是不全面去看数据,如2015年M2的增速是13.3%,比2014年上升了1.1个百分点,但GDP增速却比2014年下降了0.5个百分点。没有人质疑M2的真实性吧,M2也多多少少能代表一个国家的经济体量。中国的M2是美国的两倍,但经济规模却只有美国的60%,明显不相称。如果在M2如此庞大的基础上,经济规模还要缩减,那么,大家是否又要质疑GDP被低估了呢?
的确,金融不创造“价值”,但创造GDP。2015年金融业的GDP增速达到15.9%,这主要是靠股市活跃的交易所做的贡献,当然,如果没有银行业予以资金的支持,信托、保险业的积极参与,证券业自身也不可能有那么大能量。2015年A股的交易金额竟然要占全球股市交易金额三分之一以上,使得第三产业的GDP增速达到8.3%。如果刨去股市对GDP的贡献,那么,去年名义GDP增速估计要破6了。
小结一下:中国目前及今后的经济亮点是在服务业,但大家的关注点还是在制造业。政府为了稳增长,所投放的巨额货币,脱实向虚,或多或少地创造一定的GDP增量。实际上,大家更应该关注稳增长的负面效应,而不是质疑GDP的真实性——都已经花那么大代价去稳增长了。
投资驱动:这驾马车效率最低
中国的GDP与全球其他国家GDP在构成上的最大差异,就是固定资产投资(资本形成总额)的占比过高,即中国GDP增速对投资的依赖度太高。世界银行数据库揭示,中国2011-2014这四年间,资本形成(也就是通俗讲的投资)占GDP的比重,分别为47%、47%、48%、46%。与中国该指标相同或超过中国的,只有四个国家:赤道几内亚、阿尔及利亚、莫桑比克和不丹。
2014年的资本形成额占GDP比重的数据中,美国19%、德国19%,日本21%,韩国29%、中国香港24%、俄罗斯20%、印度32%、巴西20%。可见中国的投资占比基本超过发达国家的一倍,同时,也远高于发展中国家。实际上,中国的这一占比几乎是全球平均的两倍(全球2013年的数据为22.2%)。2015年中国的资本形成总额在GDP中的占比降至44%,仍然很高。
假如投资的高增长可以带来企业盈利的相应增长,或者不至于让企业和社会的债务率快速上升,这样的投资是无可指责的。但中国自2001年至2015年,固定资产投资年均增速为22%,同期GDP的年均增速在9%左右。近5-6年来债务的增长一直维持在两位数,尤其是去年国有企业的债务增长超过18%。
投资效率之所以低下,主要有几个原因:一是政府主导投资,各地开展GDP增长锦标赛,大兴土木,全国城市面积的扩大规模远超人口流入的规模。投资往往不是市场导向,市场在资源配置中很难真正起到决定性作用。
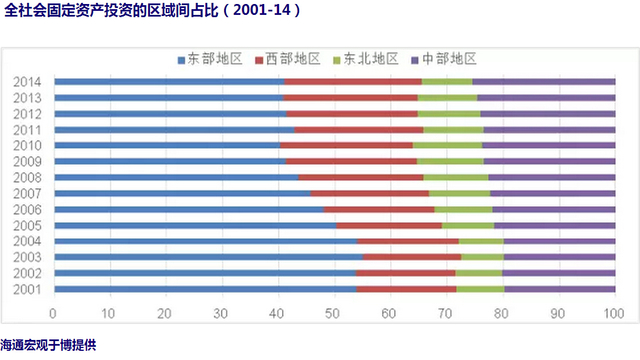
二是区域发展战略上,先后实施了西部大开发、东北振兴和中部崛起三大战略,这三大板块的投资增速大大超过东部地区,但资金流向与人口流向相背离,生产要素之间的错配导致投资效率低下,即投资占比高的地区,GDP占比没有得到相应提升(下图)。如东部地区投资占比从2001年的60%降至40%,但GDP份额只是略有下降,仍在50%以上。中部、西部和东北的固定资产投资占比不断上升,但对本区域的经济拉动作用不明显,所以,人口不断外流。
三是国有企业获得更多的信贷资金支持,但投入产出比远低于民营企业,同时又加剧了产能过剩问题,导致国企的债务高企,2015年债务占GDP的比重达到116%。为何经营业绩差的国有企业反而能获得更多的贷款支持呢?因为国企的背后有政府的信用作担保,但民营企业,尤其是轻资产的民营企业则缺乏融资渠道。
尽管2016年第一、二季度的固定资产投资增速会维持反弹趋势,但预测全年增速会略低于2015年,大约在9%左右。
简单概括,投资的三大主要问题是,资金流与人口流的错配、政府与市场之间的投资错位和高投资与高回报之间的逆向选择。
消费马车速度均匀:却在扭曲前行
消费与居民的收入水平和收入结构有很大相关性。回顾一下历年GDP中消费的贡献,都是很稳定的,且消费的增速的斜率也很平稳,从过去每年13-14%,降至目前的10-11%。此外,消费升级也如期而至,表现为吃住的占比明显下降,而交通通讯、文化娱乐和医疗保健的支出增加。
值得一提的是,国家统计局在今年1月份对CPI的八大类商品和服务的权重做了调整:“本轮基期的食品烟酒权数下降3.4个百分点(其中,旧口径食品权数下降3.2个百分点),生活用品及服务权数下降1.1个百分点;居住权数上升2.2个百分点,交通和通信权数上升1.1个百分点,医疗保健权数上升1.3个百分点。”
按照新的权重规则推算,2016年肉禽类价格权重从2015年的6.4%调整到2016年的4.35%,其中猪肉价格权重从上一年的3%调低到2.34%。这样,猪肉价格上涨对CPI的拉动作用就有所缓解。尽管大家对于通胀预期强烈,但本人判断这轮物价上涨的幅度有限,即不会超过2010-11年CPI涨幅。在全球经济疲弱的背景下,全年估计还是很难突破3%。所谓滞胀之说,本人认为可能性不大。
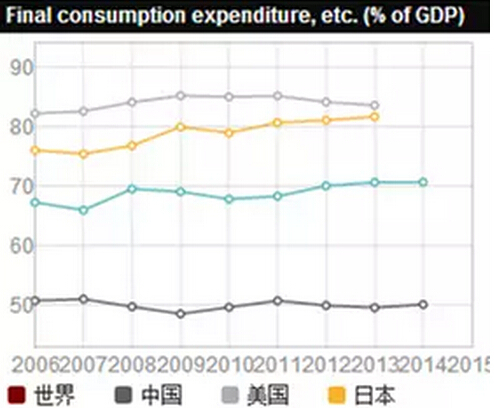
消费这驾马车在中国GDP中的比重一直波动不大,中国的最终消费对GDP的贡献在90年代时曾经占到65%,之后大幅回落,如今也不过回升到50%,比发达国家要落后很多,如美国、日本都在80%以上;即便与新兴国家比,也明显落后,如印度也要占到70%。同时,消费存在一定的扭曲现象,这与中国居民的收入结构有很大关系。
支出法下最终消费占GDP比重
中国已经是全球奢侈品消费的第一大国,但中国还是存在有效需求不足问题。我曾经就国人到日本旅游购买马桶盖现象做过细致分析,发现智能马桶中国潜在消费者的数量大约为2500万户家庭,但迄今为止中国还没有能够使用坐便器的人口超过6亿,也就是说,超过6亿的人口是买不起马桶的。因此,与其强调有效供给不足问题,不如更应关注有效需求不足导致的产能过剩问题。
有效需求不足的背后是中国中产阶层占比很小,即中国的贫富差距悬殊,从国家统计局的统计年鉴上可以发现,尽管城乡之间的收入差距有所缩小,但城镇居民的收入差距却在扩大,如根据国家统计局的数据,城镇最高收入10%家庭与最低收入10%家庭的收入差距,在最近5年内是扩大的。
中国在2015年的出境游人次大约是1.2亿,但其中很大一部分是去港澳,且不过夜。按本人估算,2014年除去港澳出境人次后,出境且过夜的人次大约在5000万左右,如果再剔除多次出国因素,出国旅游的人口也就4000万左右,占总人口2.9%。因此,中国的富人和中产的数量,估计最多也就7000万左右,占总人口数量5%左右。
对于中国人出国旅游的平均消费额全球最高的现象,我认为倒恰恰是中产阶层占比较少、收入水平不高的体现。因为出国消费的大部分钱都用在购物上了,而购物的目的是为了逃避高关税,把旅游的钱“赚回来”。这与90年代国内旅游的游客拿着大包小包返回的道理是一样的。所以,中国消费这驾马车是有点扭曲的,扭曲的背后是居民收入结构分布的畸形。
不过,2012年以来,我一直认为居民的消费规模是被低估的,主要被低估的部分是支出法下的服务性消费。如存在无法统计或经营者为避税而少报现象,这些服务消费可能发生在某些餐饮、娱乐休闲、保健、家政服务等服务业的子行业中(下图,详见《中国经济结构存在误判》2012)。
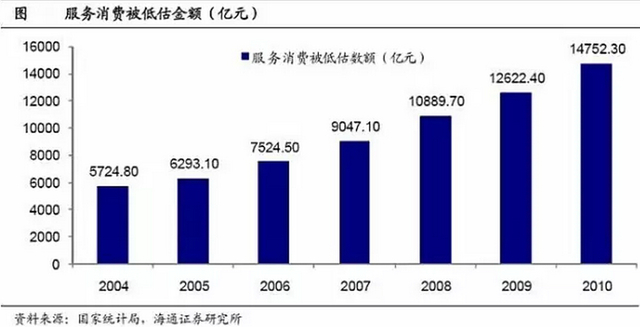
按本人的估算,最终消费占GDP的比重,可能低估了两个百分点左右,这也是我不认可GDP数据虚高的原因。从GDP的构成看,资本形成倒是可能被高估的,但消费则被低估。从区域看,民营经济发达的省份,如浙江、广东,消费是被低估的;而在国企占比较高或落后的地区,投资往往被高估。
出口全球份额第一:但这驾马车在拖后腿
2015年出口增速为-1.8%,是2009年以后首次出现的负增长。而在2015年的两会上,商务部部长预测当年出口增速为6%。反差如此之大,只能说明全球经济很低迷,同时也说明中国的出口优势在削弱。今年2月份中国出口增速下降超过20%,为09年次贷危机之后的最低点。
尽管2015年中国出口增速出现了负增长,但出口额在全球的市场份额却继续上升,超过13%,原因是其他国家出口降幅更大。但中国作为出口第一大国,与美国、日本和德国这些出口大国相比,有一个显著的差别,就是货物出口中的加工贸易占比过高。2015年,一般贸易与加工贸易之比是6:4,尽管加工贸易的占比过去曾达到50%左右,近年来已经有所下降,但如此之高的占比,还是反映出中国的仍然不是外贸强国,而只是高度依赖于为发达国家提供产品加工、组装服务的外贸大国而已。
中国未来的出口的前景不容乐观,压力主要来自三个方面:一是国内劳动力成本的上升。劳动力价格的上升具有刚性,这已经导致国内的部分制造业向劳动力价格更加低廉的东南亚国家转移。
二是未来人民币贬值幅度或有限,出口的汇率优势难以形成。中国自2014年以来出口增速就出现了明显的回落,尽管人民币对美元不再升值,但由于其他货币的贬值,导致人民币的实际有效汇率仍是上升的。今后为了应对资本外流的压力,估计人民币的贬值幅度很有限,形成不了汇率优势。
三是美国、德国的再工业化对中国出口的负面影响。机械工业信息研究院课题组研究员鞠恩民称,中国制造业成本不仅高于东南亚、南亚、东欧,并且达到了美国制造业成本的90%以上,其中珠三角、长三角达到美国制造业成本的95%,中国制造业成本竞争力正面临压力,2004-2014年,中国的年均工资增长率一直处于10%-20%区间。
中国制造业中的某些成本如电力成本、物流成本等都很高;劳动力成本也在快速上升。西方国家如美国、德国等随着机器人的广泛使用,成本有望进一步下降。如德国推出了工业4.0,法国也准备效仿德国进行再工业化;德国2月份的出口额就出现了大幅回升。因此,中国出口贸易所面临的挑战,将是全方位的,既来自发达国家,又来自发展中国家;既有成本压力,又有技术瓶颈。
估计2016年的出口增速仍然为负,大约在-2%到-4%之间。
通过对三驾马车的分析,我们很难得出一个乐观的结论。尽管今年第一季度的投资和盈利数据出现一定的好转,但这似乎只是短暂的反弹,2015年货币政策和财政政策都是超宽松和积极,总该有所反应吧。
某些光鲜数据的背后,存在太多的缺陷和矛盾。尽管中国已经是全球制造业第一大国,重化工业化也已经步入后期,但竞争力依然不强。投资主要体现为大兴土木,在设备投资和研发投资等方面的占比太低。建立在廉价劳动力基础上的出口优势,终究会转化为出口劣势。消费原本应该是拉动经济增长的最大一匹马,但一味追求高增长高投资,降低了几代人的生活质量。改革滞后导致收入结构的扭曲,让消费对GDP的贡献处于较低的水平。
如果说,资本市场的价格波动不那么合乎逻辑,经济下行也会出现牛市;如果说,足球的输赢还有运气的成分,踢得不好还能出线的话,那么,经济发展却是非常符合逻辑的,很难有侥幸摆脱困局的机会。如出国人群的平均消费额全球第一,改变不了国内产能过剩的现状;外贸出口份额的全球第一,改变不了2016年出口继续负增长的趋势;GDP增速的全球领先,是建立在全社会债务水平增速更快的基础之上。
什么样的体制,就会有什么样的经济特征;设立什么样的目标,就会为了实现该目标而付出相应的代价。如果改革不推进,结果就不会出人意料。

CHINA was right to turn on the credit taps to prop up growth after the global financial crisis. It was wrong not to turn them off again. The country’s debt has increased just as quickly over the past two years as in the two years after the 2008 crunch. Its debt-to-GDP ratio has soared from 150% to nearly 260% over a decade, the kind of surge that is usually followed by a financial bust or an abrupt slowdown.
China will not be an exception to that rule. Problem loans have doubled in two years and, officially, are already 5.5% of banks’ total lending. The reality is grimmer. Roughly two-fifths of new debt is swallowed by interest on existing loans; in 2014, 16% of the 1,000 biggest Chinese firms owed more in interest than they earned before tax. China requires more and more credit to generate less and less growth: it now takes nearly four yuan of new borrowing to generate one yuan of additional GDP, up from just over one yuan of credit before the financial crisis. With the government’s connivance, debt levels can probably keep climbing for a while, perhaps even for a few more years. But not for ever.
When the debt cycle turns, both asset prices and the real economy will be in for a shock. That won’t be fun for anyone. It is true that China has been fastidious in capping its external liabilities (it is a net creditor). Its dangers are home-made. But the damage from a big Chinese credit blow-up would still be immense. China is the world’s second-biggest economy; its banking sector is the biggest, with assets equivalent to 40% of global GDP. Its stockmarkets, even after last year’s crash, are together worth $6 trillion, second only to America’s. And its bond market, at $7.5 trillion, is the world’s third-biggest and growing fast. A mere 2% devaluation of the yuan last summer sent global stockmarkets crashing; a bigger bust would do far worse. A mild economic slowdown caused trouble for commodity exporters around the world; a hard landing would be painful for all those who benefit from Chinese demand.
Brace, brace
Optimists have drawn comfort from two ideas. First, over three-plus decades of reform, China’s officials have consistently shown that once they identified problems, they had the will and skill to fix them. Second, control of the financial system—the state owns the major banks and most of their biggest debtors—gave them time to clean things up.
Both these sources of comfort are fading away. This is a government not so much guiding events as struggling to keep up with them. In the past year alone, China has spent nearly $200 billion to prop up the stockmarket; $65 billion of bank loans have gone bad; financial frauds have cost investors at least $20 billion; and $600 billion of capital has left the country. To help pump up growth, officials have inflated a property bubble. Debt is still expanding twice as fast as the economy.
At the same time, as our special report this week shows, the government’s grip on finance is slipping. Despite repeated efforts to restrain them, loosely regulated forms of lending are growing quickly: such “shadow assets” have increased by more than 30% annually over the past three years. In theory, shadow banks diversify sources of credit and spread risk away from the regular banks. In practice, the lines between the shadow and formal banking systems are badly blurred.
That creates two risks. The first is higher-than-expected losses for the banks. Hungry for profits in a slowing economy, plenty of Chinese banks have mis-categorised risky loans as investments to dodge scrutiny and lessen capital requirements. These shadow loans were worth roughly 16% of standard loans in mid-2015, up from just 4% in 2012. The second risk is liquidity. The banks have become ever more reliant on “wealth management products”, whereby they pay higher rates for what are, in effect, short-term deposits and put them into longer-term assets. For years China restricted bank loans to less than 75% of their deposit base, ensuring that they had plenty of cash in reserve. Now the real level is nearing 100%, a threshold where a sudden shortage in funding—the classic precursor to banking crises—is well within the realm of possibility. Midsized banks have been the most active in expanding; they are the place to look for sudden trouble.
Pandamonium
The end to China’s debt build-up would not look exactly like past financial blow-ups. China’s shadow-banking system is big, but it has not spawned any products nearly as complex or international in reach as America’s bundles of subprime mortgages in 2008. Its relatively insulated financial system means that parallels with the 1997-98 Asian crisis, in which countries from Thailand to South Korea borrowed too much from abroad, are thin. Some worry that China will look like Japan in the 1990s, slowly grinding towards stagnation. But its financial system is more chaotic, with more pressure for capital outflows, than was Japan’s; a Chinese crisis is likely to be sharper and more sudden than Japan’s chronic malaise.
One thing is certain. The longer China delays a reckoning with its problems, the more severe the eventual consequences will be. For a start, it should plan for turmoil. Policy co-ordination was appalling during last year’s stockmarket crash; regulators must work out in advance who monitors what and prepare emergency responses. Rather than deploying both fiscal and monetary stimulus to keep growth above the official target of at least 6.5% this year (which is, in any event, unnecessarily fast), the government should save its firepower for a real calamity. The central bank should also put on ice its plans to internationalise the yuan; a premature opening of the capital account would lead only to big outflows and bigger trouble, when the financial system is already on shaky ground.
Most important, China must start to curb the relentless rise of debt. The assumption that the government of Xi Jinping will keep bailing out its banks, borrowers and depositors is pervasive—and not just in China itself. It must tolerate more defaults, close failed companies and let growth sag. This will be tough, but it is too late for China to avoid pain. The task now is to avert something far worse.
What is a hard landing? Can you re-land hard if you’ve already landed hard? What about just landing harder? Or what about a long hard landing?
The phrasing here is getting awkward, as is the real point, which is the concern that the hardest Chinese landing is yet to come.
You can see why it’s on people’s minds: Chinese reforms have been less than impressive, there’s a general consensus that its record breaking debt load is bad (for a given definition of bad that normally doesn’t include an immediate crisis), and credit growth is still heading up. Take this from Bernstein’s metals and mining team on Monday for example:
The response to the crisis of 2014/2015 appears to be greater than the response to the financial crisis of 2008/9. Between November 2008 and November 2009 total domestic credit expanded from 36.3Trn RMB to 48.4Trn RMB, a change of 12.1Trn or ~34.4% of 2009 GDP. Between February 2015 and February 2016 domestic credit has grown from 111.2Trn RMB to 139.2Trn, a swing of 27.9Trn, or ~40.4% of GDP.
The evidence for this can also be found in the money supply growth figures and the growth in the assets and liabilities on the balance sheets of Chinese banks. M2 money supply growth has recovered from trough levels witnessed in mid-2015. However, it is M1 money supply growth – the measure of the more liquid component of the money supply – that has really taken off. Meanwhile, we have seen a surge in the growth of Chinese domestic banks’ assets and liabilities since the start of 2015.

Again, that seems pretty bad.
Which leaves us to ask, where hard landings are concerned: how would you describe what we’ve already experienced?
Speaking of, you may remember this:
And, even if you don’t, here’s SocGen’s opening few pars:
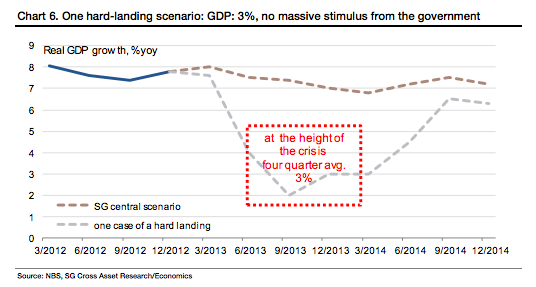
Our core scenario is that China will grow by 7.4% in 2013. There is still a chance however that China could land hard, with growth of less than 6%.
A survey of global investors suggests that most underestimate how much asset prices would fall if China does land hard.
We believe base metals could drop 50%, while the USD rallies and treasuries outperform other debt markets and global equity markets.
We thought some compare and contrast might be in order.
To be clear, this isn’t meant as a shot at SocGen. Frankly, they did a pretty good job mapping this stuff out and were admirably sceptical about China’s growth path. And they got the primary issue right, that it’s “the top leaders’ choices during the difficult times ahead that will determine the fate of the Chinese economy.”
This post is more to underline that by many definitions — and discounting internally generated stats which, as you know, aren’t the cleanest of measures in China, even if China protests that assumption — we have already had what might be described as a ‘hard landing’.
We’re not saying, for example, that the path of GDP growth has followed SocGen’s bad landing scenario but it’s interesting that the effects of such a fall appear to have played out, at least in part, via asset prices we can track.
In short, it’s all just another unsubtle probing of whether our readers should already have cracked each other’s heads open and feasted on the goo inside. Or whether they should be saving the goo for a later date.
Here’s what SocGen predicted would happen if China suffered a hard landing back in 2013 (defined variously in the report as growth below 6 per cent, and growth of around 4 per cent):
- As already mentioned, base metals could drop 50 per cent, but “the impact would be less than in the Lehman bankruptcy, when copper prices dropped by almost 75%.”
- Gold would bounce to begin with but “but since Chinese savers are big buyers of gold, the impact here could also be short lived.” They think that prices would rise around 15% to over $1900/oz but then drop very quickly.
- Brent is expected to drop by 30 per cent, with the drop limited to $35 with OPEC to cut production if China lands hard.
- The dollar would strengthen by 10 per cent in the first year despite easing by the Fed, with Kit Juckes arguing that “the closest historical parallel to a China hard landing would be the Asian currency crisis, when the dollar rose 12% against the yen and more than a third against the Australian dollar.” EM currencies would also suffer.
- The PBoC would allow some RMB depreciation — and it could easily shoot up to RMB7, a 10 per cent nominal depreciation — but then steady it to prevent capital flight.
- China’s FX reserves would “probably stop rising or even decline”.
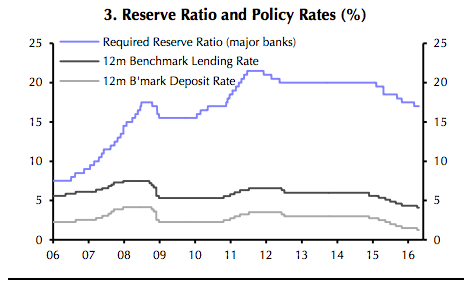
- The PBoC would both slash the Reserve Requirement Ratio (RRR) and conduct sizeable repo operations to ensure ample liquidity, which would lead to lower money market fixings. They “conservatively” estimated “that the RRR would be cut by 4.5% from 20% to the post-Lehman low of 15.5%.”
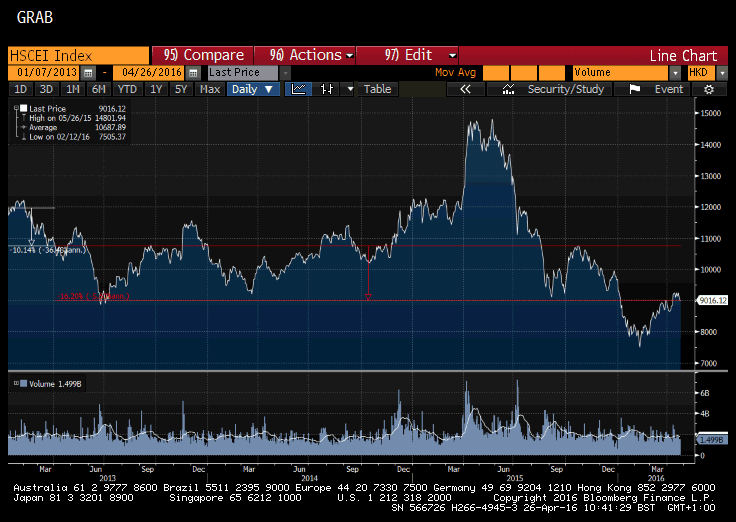
- H shares would drop maybe 50 per cent, back to 2006 levels.
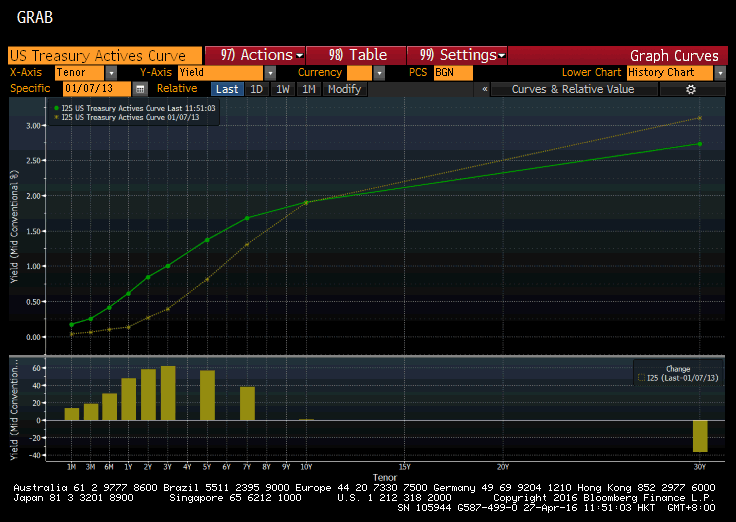
- Treasuries would remain supported, due to weaker growth, central bank easing and capital flows out of Asia.
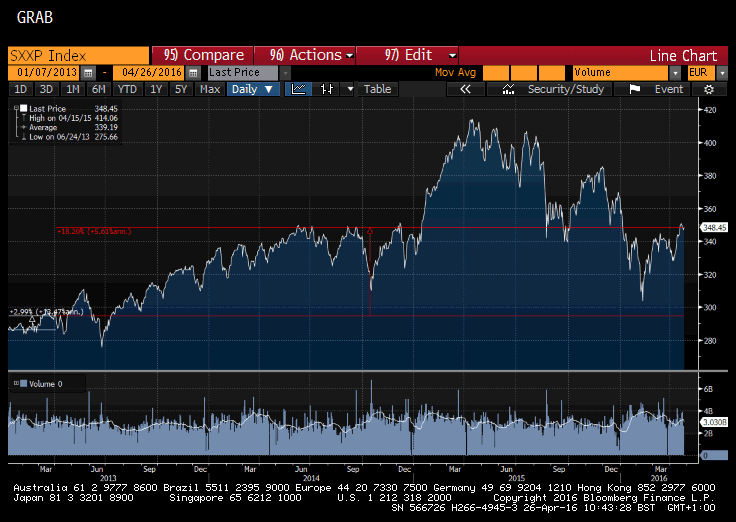
- European equities would fall by as much as 20 per cent.
- And they think that a slump in Chinese growth would “trim global growth from 2.7% to 1.1%” and that’s including the mitigating effect of their forecasted fall in oil prices.
So… what did we get? And, yes, we have to admit that this is somewhat of an exercise in futility because each of these moves has been influenced by other factors. But since we are kind of stuck on the raw data stuff with China it’s the effects of its slowdown which we have to rely on. Even taking the multiple-causes of every move into account, the magnitude of some of these makes pointing to China as a prime cause pretty easy.
Here’s a SocGen table on metals and oil to start. It gives us the prices as of January 7 2013 and their expected prices one month after a hard landing:
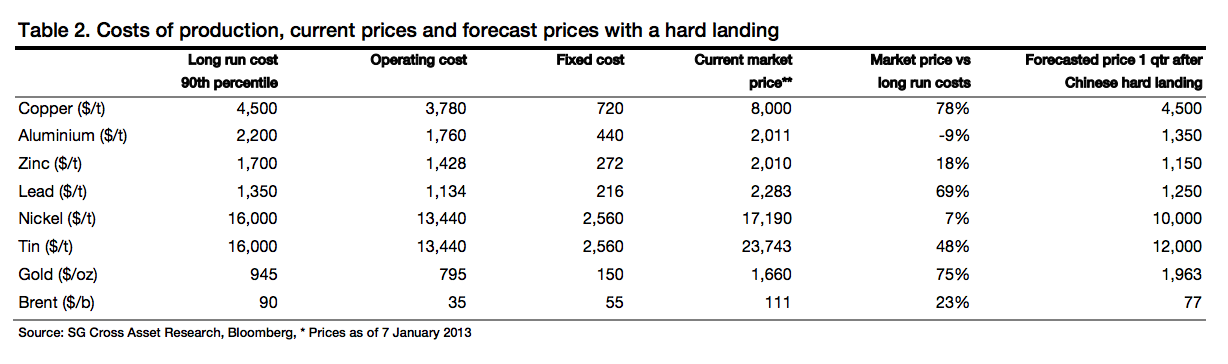
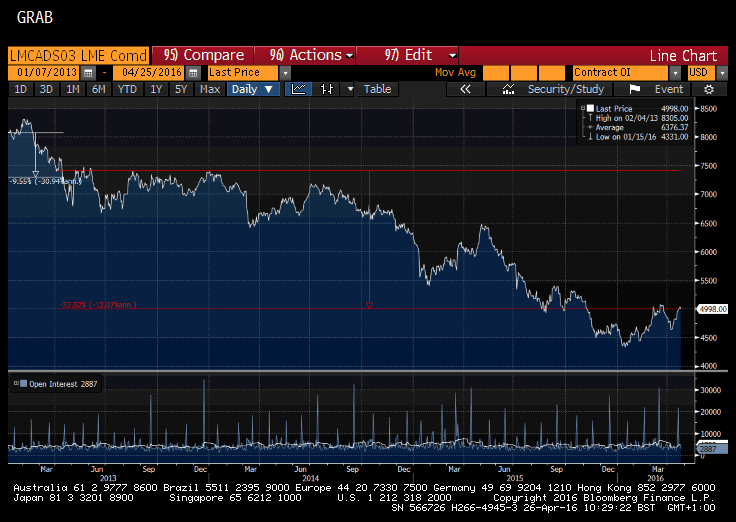
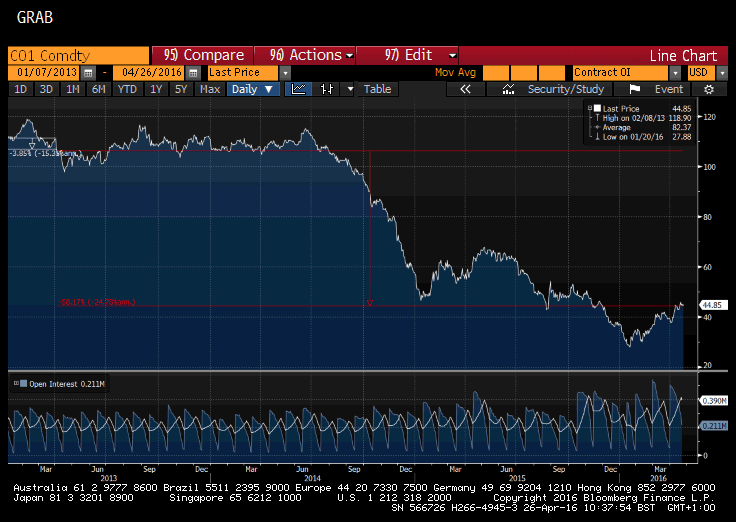
First copper: It was at $8,000/tn (as all of the metals here are bar gold) and was predicted to fall to $4,500 within the first quarter of a hard landing. It didn’t manage that on SocGen’s timetable, but it got close in the first quarter of this year, hitting a low of $4,331. We’re using the 3mth LME prices here:
Aluminium was at $2,011 and was predicted to hit $1,350. It hit a low of $1,434 in November 2015.
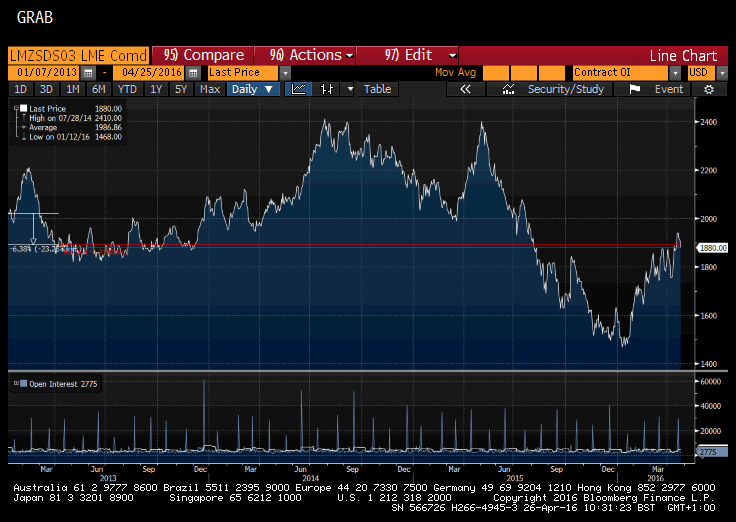
Zinc was at $2,010 and was to fall to $1,150. It didn’t and is holding under $1,900 today. The lowest it got was $1,468 in January. Still though, that’s a fall of about 27 per cent.
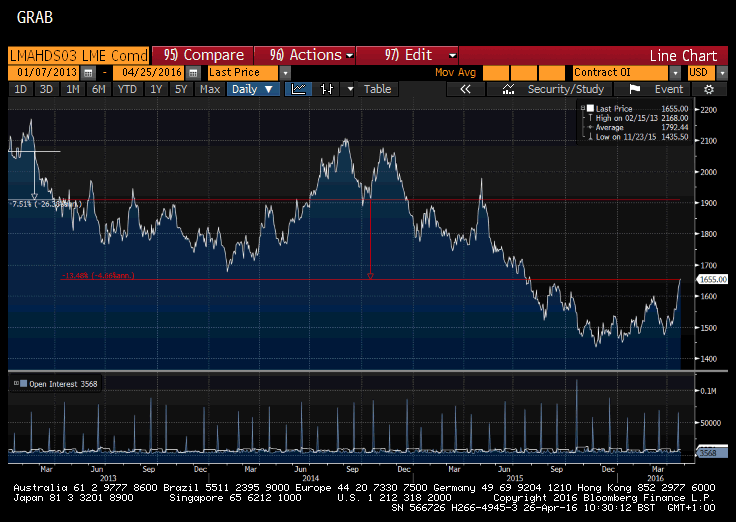
Lead was at $2,283 and was to fall to $1,250. It didn’t quite manage that and is now at about $1,750. It’s low point in November last year was $1,575, a drop of 30 per cent since SocGen’s original call.
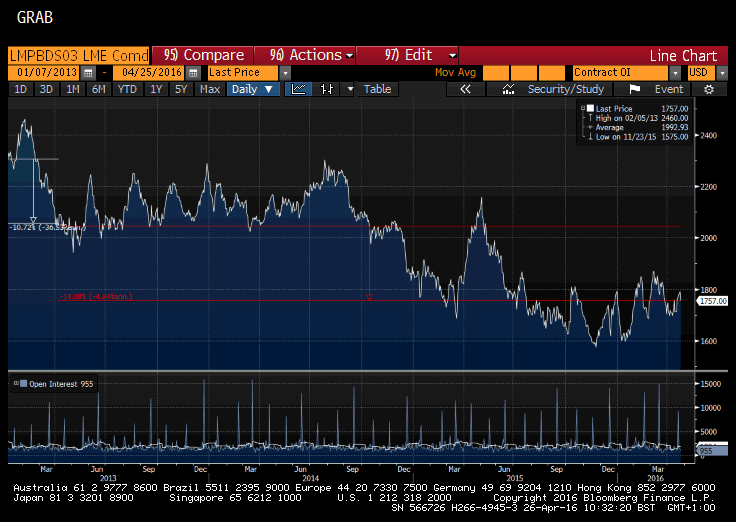
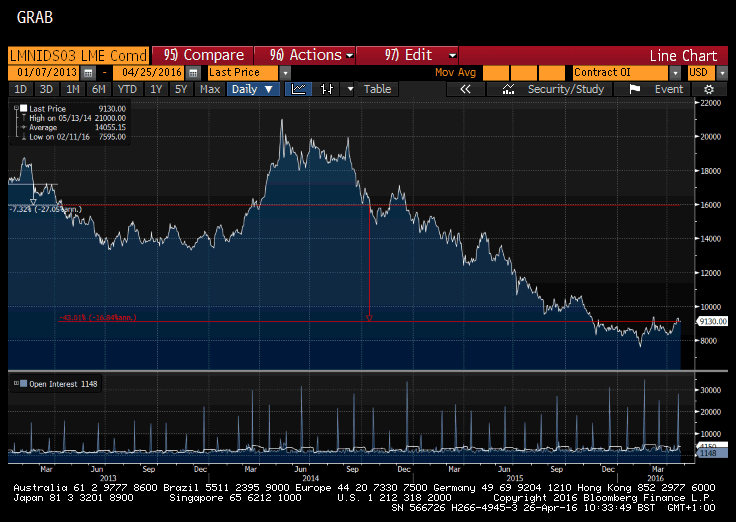
Nickel was at $17,190 and was to hit $10,000. It didn’t in the first quarter but did so with aplomb more recently. It’s currently at $9,100.
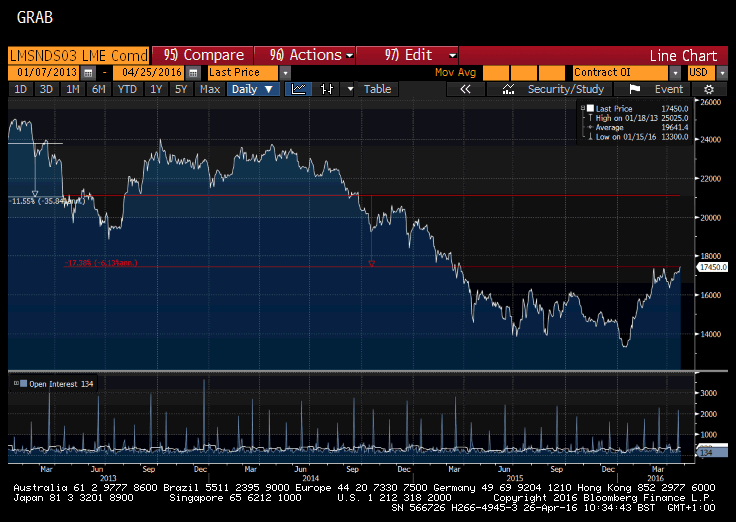
Tin was at $23,743 and was supposed to hit $12,000 in the first quarter of a Chinese hard landing. It didn’t. It came close though, nearly touching $13,000 in January of this year for a drop of 41 per cent. It’s off 26 per cent from SocGen’s 2013 price today.
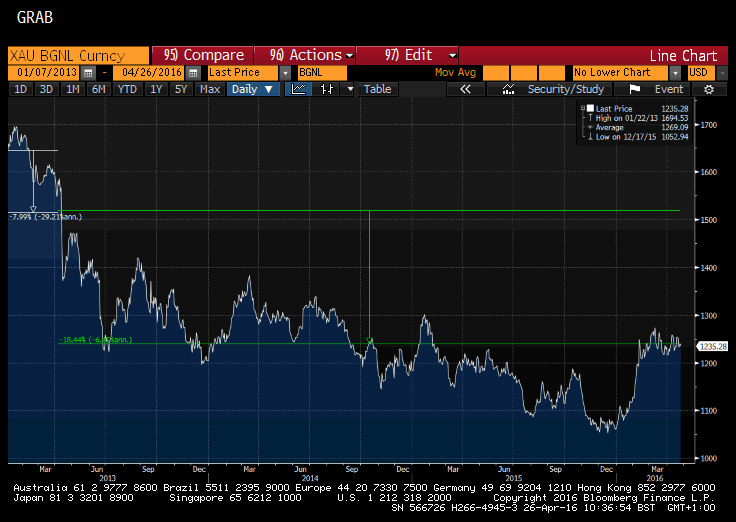
Gold was at $1,660/oz and was to hit $1,963 in the first quarter of a hard landing before dropping very quickly. However it popped to just $1,691 on January 22 2013 before falling to a low of $1,062 on December 17 2015 — a more dramatic 36 per cent fall. The broad direction seems about right then.
Brent was at $111 per barrel and was to drop to $77. In reality and as we all know, it fell to a low of $27.88 on January 20 of this year for a drop of about 74 per cent. It currently sits at around $44, down 60 per cent from SocGen’s starting point.
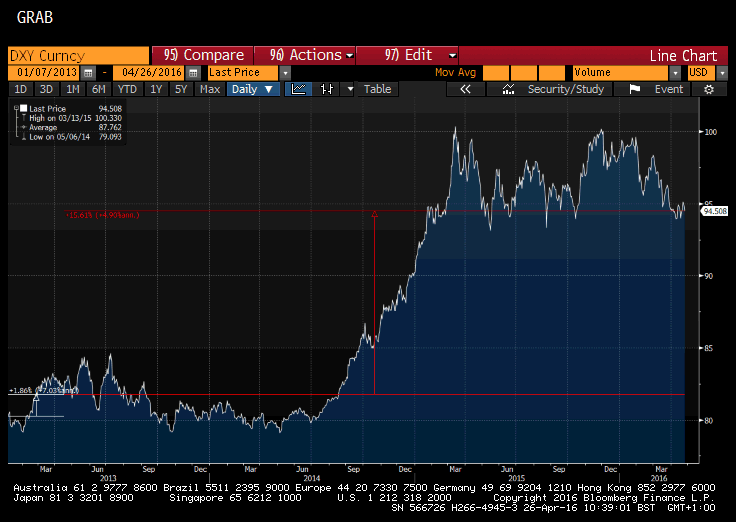
The dollar was indeed broadly stronger and outdid SocGen’s expectations of a 10 per cent rise, before weakening a bit as the Fed got dovish. Here’s DXY, which was at 80 on January 7 2013. It hit 100.3 on March 13 2015 and is now at 94. So it’s up about 17.5 per cent having been up 25 per cent. EM currencies meanwhile suffered, hitting all time lows in January this year before recovering a bit.
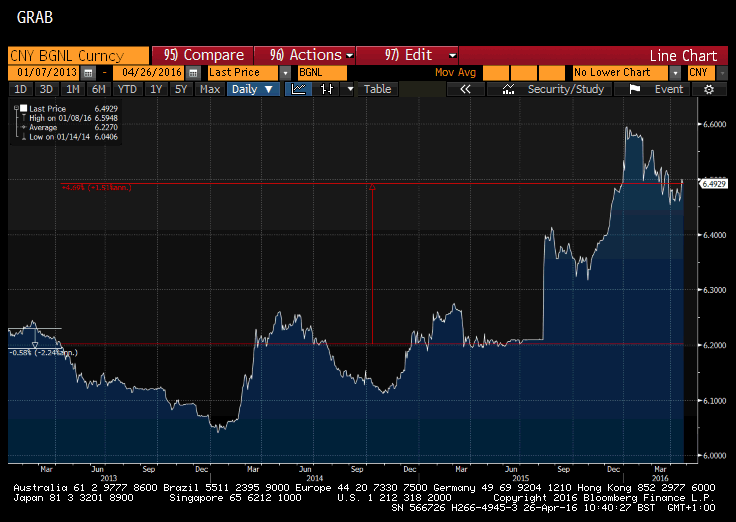
And the dollar versus the RMB. It started at RMB6.12 before weakening to RMB6.59 and is now at RMB6.46. That’s pretty much “allow some RMB depreciation — and it could easily shoot up to RMB7, a 10 per cent nominal depreciation — but then steady it to prevent capital flight.”
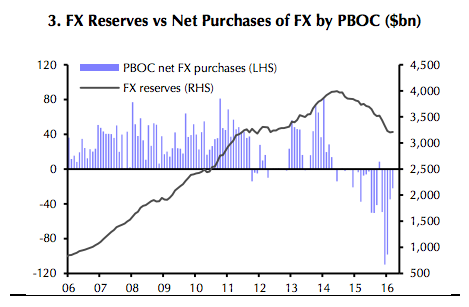
Speaking of capital flight, China’s FX reserves (courtesy of Capital Economics) remain one of the major stories, reflecting as they do capital outflows/ flight. They’re down just a touch, exceeding SocGen’s qualitative prediction one imagines:
The RRR is closer to SocGen’s predicted 15.5 per cent and most won’t be surprised to see it fall further:
How about HShares? Well the HSCEI Index was at 11,937 points when this report came out and dropped to a low of 7,505 points by February 2016. That’s a fall of 37 per cent from SocGen’s original point. Today the index is about 9,000, off 23-ish per cent. So not quite the 50 per cent predicted by SocGen but hefty nonetheless and even more dramatic from that recent peak in the summer of 2015 – that’s a fall of 49 per cent peak to trough.
Treasuries have been broadly supported with caveats. Have a yield curve comparison, between January 2013 and now:
And European equities? They were to fall by as much as 20 per cent. Yeah, not quite.
Global growth meanwhile has obviously been effected by China’s slowdown (points for the oil price drop helped by shale etc and central bank action mitigating some of it of course) with the FT saying “that the drop in its growth rate from an expansion of more than 10 per cent in 2010 to 6.3 per cent expected this year has directly knocked about 0.75 percentage points off the global growth rate.” But we’ll just leave you with the latest IMF projections on that, and some broader analysis on indirect effects from the same place.
Overall then there is a strong case to be made that the rest of the world has already experienced a Chinese ‘hard landing’ of sorts, based on that original SocGen note.
Which we suppose is good news since the world didn’t actually end.
Thing is, so far it hasn’t looked like a hard landing from within a China that has the levers to manage employment and widespread financial instability.
It has avoided those things — while starting to talk up new supply side reforms — by pressing on the old levers of credit stimulus. That, of course, risks making any future reckoning all the more dangerous.
As SocGen’s Wei Yao said in a 2014 update to their hard landing report: “The easy but dangerous choice would be for Beijing to repeat the post-Lehman package of massive state-driven lending and investment facilitated by ultra-low interest rates and ample liquidity.”
Awkward, but as said above, most analysts think that China has the tools to manage short term risks. It’s just the longer term risks we have to worry about then as China aims for some sort of long, as opposed to hard, landing.
Of course, there’s always the chance we are plain getting this wrong. As Bernstein’s Michael Parker said in a recent note:
Which brings us to the topic of the moment – accelerating credit formation growth and widening credit spreads. The explanations fall into the same categories they always fall into: Chinese policy is simple-minded and focused only on averting the immediate disaster; Chinese policy making is dysfunctional; Chinese policymakers have a plan… but that plan has not revealed itself to you yet. The incremental ~$1 trillion of credit pumped into the system since January looks, for all the world, like an enormous overreaction. However, it is just possible that Chinese policymakers – after getting so much right for the last 30 years – truly are crazy like a fox.
Either way, we might need to simply redefine hard landing as we go.
