


The stock price of Level 3 Communications (LVLT) has lost over 99% of its value since 1999. As one of the most hated stocks on the street, it has disappointed so many investors over the years and even the most stubborn longs are so frustrated by it that they have pretty much written off the stock by now.
However, recently the company has a change of leadership and is also undergoing a major transformation in its business focus. The lack of interest by the general public has reflected in its stock price as illustrated in the chart below. The stock has been trapped in a trading range between $19 and $25 for almost 2 years. One of my favorite criteria for a long term buy is to identify a beaten down stock that is hated and has been almost forgotten by the general public. It must have bottomed and formed a long trading range base and is about to breakout. LVLT appears to be such a candidate and requires further study.
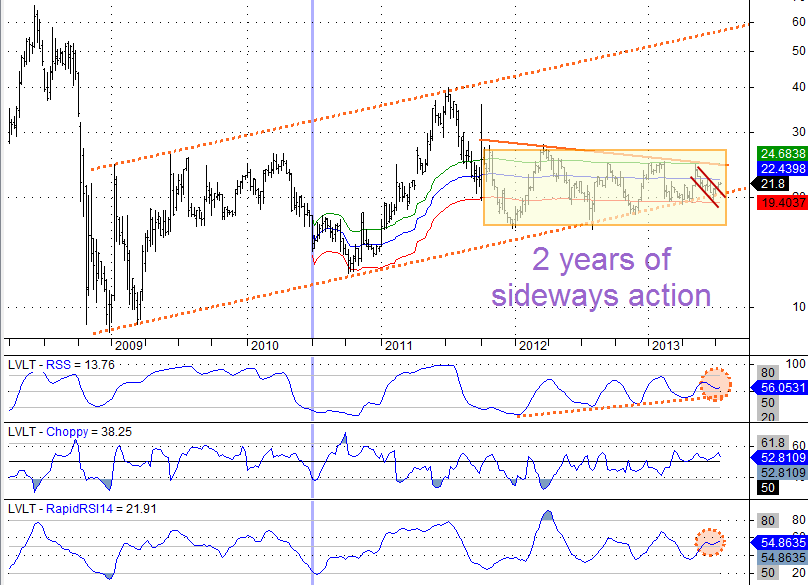
- LVLT has bottomed @ $8.55 in late 2008 and early 2009 and has since formed multiple higher highs and higher lows.
- The stock has since traded in a well-defined channel. It closed yesterday @ $21.80 and is sitting just above the lower channel line.
- The stock has been in a 2 year-long long trading range market between $19 and $25 with a good support @ $19. In general the longer the sideways action, the resulted breakout move tends to be stronger and longer.
- The volume (not shown) during the trading range is high comparing with the period from 2009 to mid 2010. This is an indication that smart money is actually accumulating LVLT during this period.
- The most recent upward movement during early May had a steeper angle hinting the direction of the breakout is up and the breakout is likely sustainable.
- The following downward movement was weaker since both Rapid RSI and RSS were unable to break below the 50 line.
- The latest trading channel has been broken which has triggered a buy signal (refer to Toni Hansen’s “Everything you know about breakout trading is wrong” that I posted here previously).
Trading plan:
One of the strategies Stanly Knoll used to anticipate a trading range breakout was to buy at the support and sell ½ at the resistance. Repeat this until it finally breaks out the range so to accumulate a good size position. What I will do for this trade is to get 2/3 my intended size first near the support (I have already got 1/3 now) and will put a tight stop for half of the position based on 4 hour or 1 hour chart once it trades near $25 resistance level using a 4 hour/ 1 hour chart. If the stop is triggered, I will try to repurchase the lost shares near support again. If LVLT break the $25 resistance I will buy the remaining 1/3 once the breakout is confirmed. Target is the upper trading channel somewhere near $60. Stop is just under $19.
