


周四 ,五, 天然气来了一个迅速下跌, 从高点到低点之差接近10%, 这种动荡是快速交易的良机。
这个sell off 据说是因为市场认为从元月中旬气温会回升, 加上库存报告数字稍微利空。
天然气现在何去何从?考虑到几个不同因素分别说说:
1.天气:
昨天, 今天 东北部很多地方是创纪录的低温天气, 由于上周末的暴风雪, 天然气用量也创了新纪录,新年当天 估计天然气用量 达到150附近, 比原先估计(143)提高。中部本周初会有一短暂的气温回升和降水, 雨雪天气, 但后半周依然很冷,一周后气问有所回升, 也仅仅是 从超低温回升接近正常一些而已。气温仍低于平均。
2.库存:
上周4天然气库存报告,下降稍少于预期量,这也是sell off的一个理由。 这周天然气库存预期下降335, 下周227, 这些数字远远超出5年平均水平。可以预见的的是, 这个长达大约三周的超低温天气, 对天然气的供需平衡的影响绝对不能低估。从下面的图看。 到这个冬季结束, 天然气库存可能降低都1300 左右, 会大大低于5年平均水平, 甚至低于5年最低水平。
3. 产量,
最近几天有不少因为低温引起天然气停产(冻住了)和天然气管道故障的报道。天然气产量近几个月成上升趋势, 但不可忽视的是需求量也是创纪录 的增长。加上出口增长, 基本可以抵消增产。
4. 价格:
现在天然气价格仍在历史低潮期间, 而天然气库存量却要降低到过低5年最低水平,这显然是不合理的。
5. 其他:
由于过冷, 东北一些地区天然气管道运输出现故障, 天然气价格过去几天大幅暴涨,一些地区涨幅高达60倍,这说明天然气基础设施是落后的, 不适和应急需要的,也提示资本主义的邪恶性。
上周四ETR公司由于线路故障关闭了一座核电站,一旦关闭, 重开时间难以估计, 公司说要趁机检修维护。所缺电力 由替代石化电厂补充。
过去两周, 天然气CFTC净多仓有所增加, 但幅度不大。美国从加拿大进口的天然气可能会减少, 加拿大过冷, 很多地区天然气飞涨。
综合技术因素, 我认为天然气将迅速反弹, 未来几个月牛市趋势不会改变,至少没有大跌的可能性。
美国下一个经济热点应该是基础设施建设!

| Natural Gas | Electricity | Spark Spread |
|||
|---|---|---|---|---|---|
| Region | $/million Btu | % chg* | $/MWh | % chg* | $/MWh |
| New England | 82.75 | +127.8 | 247.03 | +45.3 | 0.00 |
| Mid-Atlantic | 96.07 | +106.5 | 262.24 | +58.7 | 0.00 |
| Midwest | 6.47 | +0.5 | 110.14 | +14.6 | 64.86 |
| Southwest | 3.01 | -49.8 | 30.00 | -34.4 | 8.92 |
| Northwest | 2.88 | -17.7 | 22.75 | -26.6 | 2.59 |
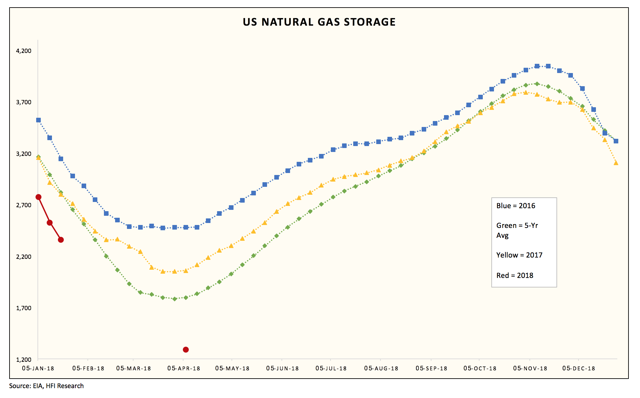
( 注意看此图:这周天然气库存会降至2800 附近, 到4月初季节性低点, 可能达到1300 附近或者更低。)
https://www.investing.com/analysis/natural-gas-got-bomb-cyclone-in-the-new-year-200278125?
https://www.eia.gov/todayinenergy/detail.php?id=34412
Cold weather, higher exports result in record natural gas demand
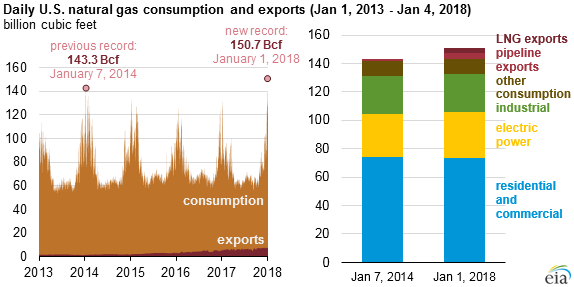
Estimated U.S. natural gas demand on January 1, 2018 reached 150.7 billion cubic feet, surpassing the previous single-day record set in 2014, according to estimates from PointLogic. Much colder-than-normal temperaturesacross much of the United States have led to increased demand for heating, much of which is provided by natural gas. Although residential and commercial natural gas consumption did not appear to surpass previous records, higher consumption in the electric power and industrial sectors, greater exports of natural gas to Mexico, and more demand for liquefied natural gas (LNG) feedstock gas contributed to the recent record demand level.
Note: Other consumption includes lease and plant fuel consumption, pipeline and distribution use, and vehicle fuel.
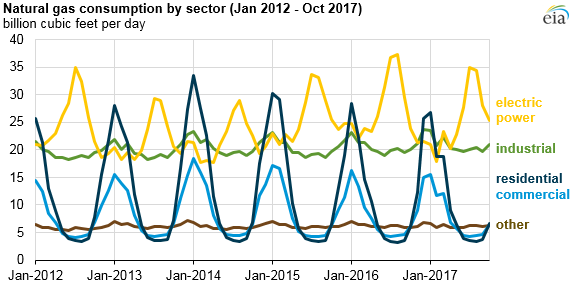
Natural gas consumption is typically highest in the winter months, when residential and commercial demand for heating fuels increases. Industrial sector consumption of natural gas is relatively less seasonal but is also higher in winter months. Although the electric power sector consumes the most natural gas during summer months, when overall electricity demand is highest, power sector consumption of natural gas can also increase in winter months. Many homes and commercial buildings use electricity either as their primary or secondary heating fuel, and overall increases in electricity demand are often met by natural gas-fired generators.
This past week, increases in demand led to higher prices in natural gas and electricity markets. Day-ahead natural gas prices for delivery for January 1, 2018, neared $30 per million British thermal units at trading locations in the Mid-Atlantic region, New York, and Boston, according to Natural Gas Intelligence. Because the spot price of natural gas affects power prices in many parts of the United States, spot wholesale electricity prices also rose, surpassing $200 per megawatthour (MWh) in New York City and $185/MWh in New England, according to data from SNL Energy.
Record demand levels are likely to lead to high withdrawals of natural gas from storage fields. EIA’s Weekly Natural Gas Storage Report (WNGSR) showed that in the Lower 48 states, natural gas storage levels as of Friday, December 29, were 3,126 billion cubic feet (Bcf), or about 6% lower than both the previous five-year average (2012–2016) and year-ago levels. In the East region, which covers the Atlantic Coast and some Midwestern states, inventory levels were 740 Bcf, equal to previous year levels and about 5% lower than the previous five-year average. Inventory changes for the week ending January 5 will be released Thursday, January 11.
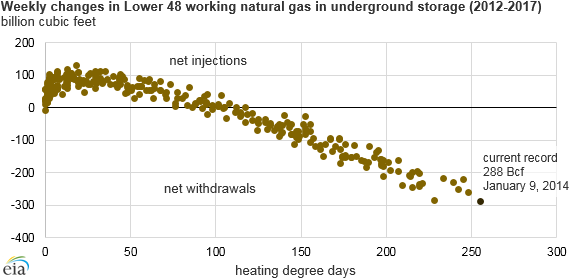
Generally, changes in natural gas storage are correlated with changes in temperature. Heating degree days represent temperature deviations below 65 degrees Fahrenheit and are weighted based on population distributions across the country. During the previous record withdrawal for the week ending January 9, 2014, U.S. population-weighted heating degree days reached 255. In that week, 288 billion cubic feet of natural gas were withdrawn from storage. For the week ending January 5, 2018, heating degree days are forecast to reach 281.
In addition to the winter heating fuels data and analysis that EIA publishes seasonally, EIA’s weather-related energy market information includes an updated presentation on winter weather indicators and a Northeast market snapshot, which provides daily information regarding Northeast natural gas and electricity markets.
Speculators boost U.S. natgas net longs for 2nd straight week -CFTC
