
There have been a lot of headlines around the low volatility in global financial markets. As I sat at my desk this week, I pondered how long it had been since the S&P 500 (SPY) posted a negative month. I knew that it hadn't happened in 2017 thus far. The last month with a negative total return for the S&P 500 was October 2016 with a -1.82% return. Coincidence or not, since the election of Donald Trump, the S&P 500 has not had a down month.
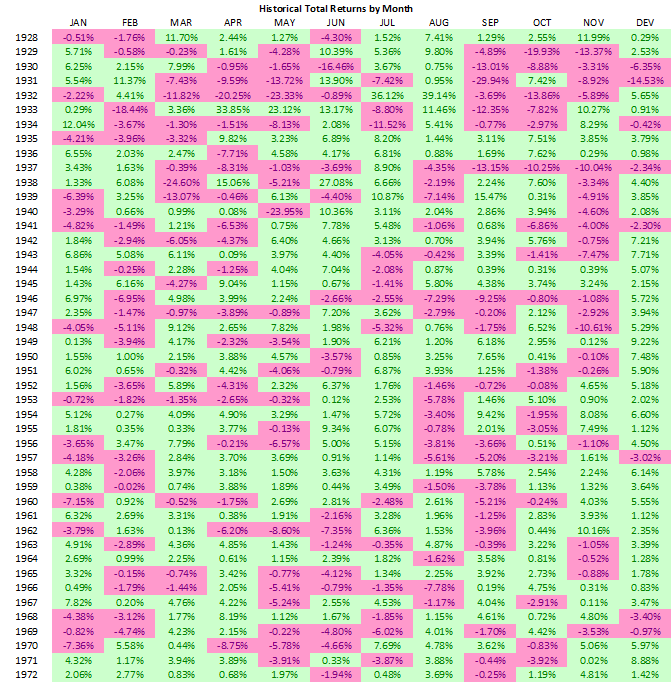
That got me pondering another question. When was the last time that we went through a full calendar year with positive total returns in every month? I brought in monthly total returns for the S&P 500 and its predecessor indices dating back to mid-1927.
The answer surprised me, and I am sure it will surprise you. It has never happened.
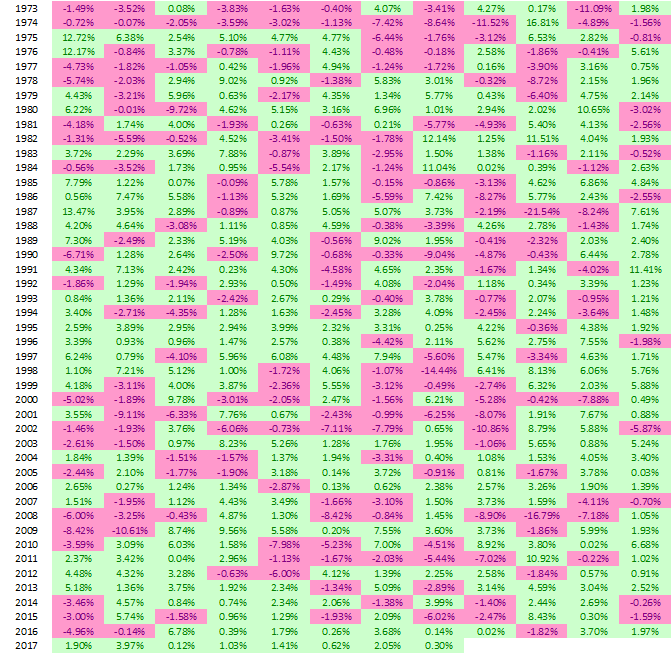
While we still have three trading days left in the month, and have produced a slim positive total return of 1.13% in September, we are closing in on 9 months to open the year with positive gains when you include the reinvestment of S&P 500 dividends. The last time we opened up a year with 9 straight months of gains was 1995.
There have only been four years where we have seen positive returns for even eleven months - the aforementioned 1995 during the early stages of the tech run-up, 2006 during the volatility void in the lead-up to the Great Recession, 1958, and 1936 as we emerged from the Great Depression only to be returned to recession in 1937.
The fact that these years of consistent gains typically preceded stock market downturns could be a warning sign or spurious correlation. Certainly markets ran plenty hard post-1995 and 1958.
Despite this impressive string of gains, the returns for 2017 have still been fairly limited on a historic basis. Two of these months produced sub-1% returns. Don't get me wrong - I would be happy to take 13.1% total return from U.S. stocks every year, but given the consistency of gains, this is still not a real breakout year.
Some might look as this streak as primed to break given the historical record. I do believe it is another data point that shows the U.S. equities are priced to near perfection. Strong and steady past returns could limit future gains, but I will take them when the market continues to hand them out. I think this is a rather interesting story. Please share your thoughts in the comments section.
Disclaimer
My articles may contain statements and projections that are forward-looking in nature, and therefore inherently subject to numerous risks, uncertainties and assumptions. While my articles focus on generating long-term, risk-adjusted returns, investment decisions necessarily involve the risk of loss of principal. Individual investor circumstances vary significantly, and information gleaned from my articles should be applied to your own unique investment situation, objectives, risk tolerance and investment horizon.