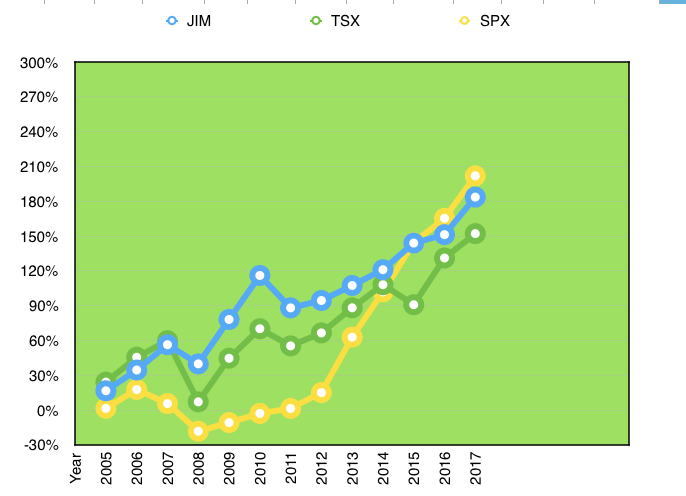
最近,下载了S&P/TSX Composite Total Return Historical Data。根据Investopedia定义:Total return, when measuring performance, is the actual rate of return of an investment or a pool of investments over a given evaluation period. Total return includes interest, capital gains, dividends and distributions realized over a given period of time. 因此以前使用的都是从yahoo数据库的不包括红利的数据,由此计算的回报率不能完全反应实际投资回报性能。此外,此次更新回报率计算,将工资收入和生活开支以流入资金和流出资金计入投资组合,得出实际投资回报率。得到修正的total return数据如下:
|
Year
|
JIM’s Total Return
|
|
TSX comp total return
|
|
|
SPX total return (CAD)
|
|
2005
|
16.63%
|
|
24.1%
|
|
|
1.5%
|
|
2006
|
15.34%
|
|
17.3%
|
|
|
16.0%
|
|
2007
|
16.24%
|
|
9.8%
|
|
|
-10.3%
|
|
2008
|
-10.57%
|
|
-33.0%
|
|
|
-22.6%
|
|
2009
|
27.37%
|
|
35.1%
|
|
|
9.1%
|
|
2010
|
21.30%
|
|
17.6%
|
|
|
8.9%
|
|
2011
|
-12.93%
|
|
-8.7%
|
|
|
4.4%
|
|
2012
|
3.37%
|
|
7.2%
|
|
|
13.5%
|
|
2013
|
6.66%
|
|
13.0%
|
|
|
41.5%
|
|
2014
|
6.56%
|
|
10.6%
|
|
|
24.0%
|
|
2015
|
10.39%
|
|
-8.3%
|
|
|
21.0%
|
|
2016
|
2.98%
|
|
21.1%
|
|
|
8.6%
|
|
2017
|
12.87%
|
|
9.1%
|
|
|
13.8%
|
2005年以前由于个人数据不完全故未计入。
图形如下:
按截止2017年12月31日市值计算,回报率及性能指标数据如下:
|
|
1 month
|
3 months
|
6 months
|
1 year avg
|
3 year avg
|
5 year avg
|
7 year avg
|
10 year avg
|
15 year avg
|
20 year avg
|
3 year risk
|
3 year beta
|
sharp
|
|
JIM’a Fund
|
-0.45%
|
5.36%
|
6.12%
|
12.87%
|
8.66%
|
7.84%
|
3.96%
|
6.13%
|
|
0.00%
|
6.75%
|
0.39
|
1.28
|
|
TSX
|
1.20%
|
4.45%
|
8.30%
|
9.10%
|
6.59%
|
8.63%
|
5.76%
|
4.65%
|
0
|
0.00%
|
7.40%
|
1
|
0.89
|
|