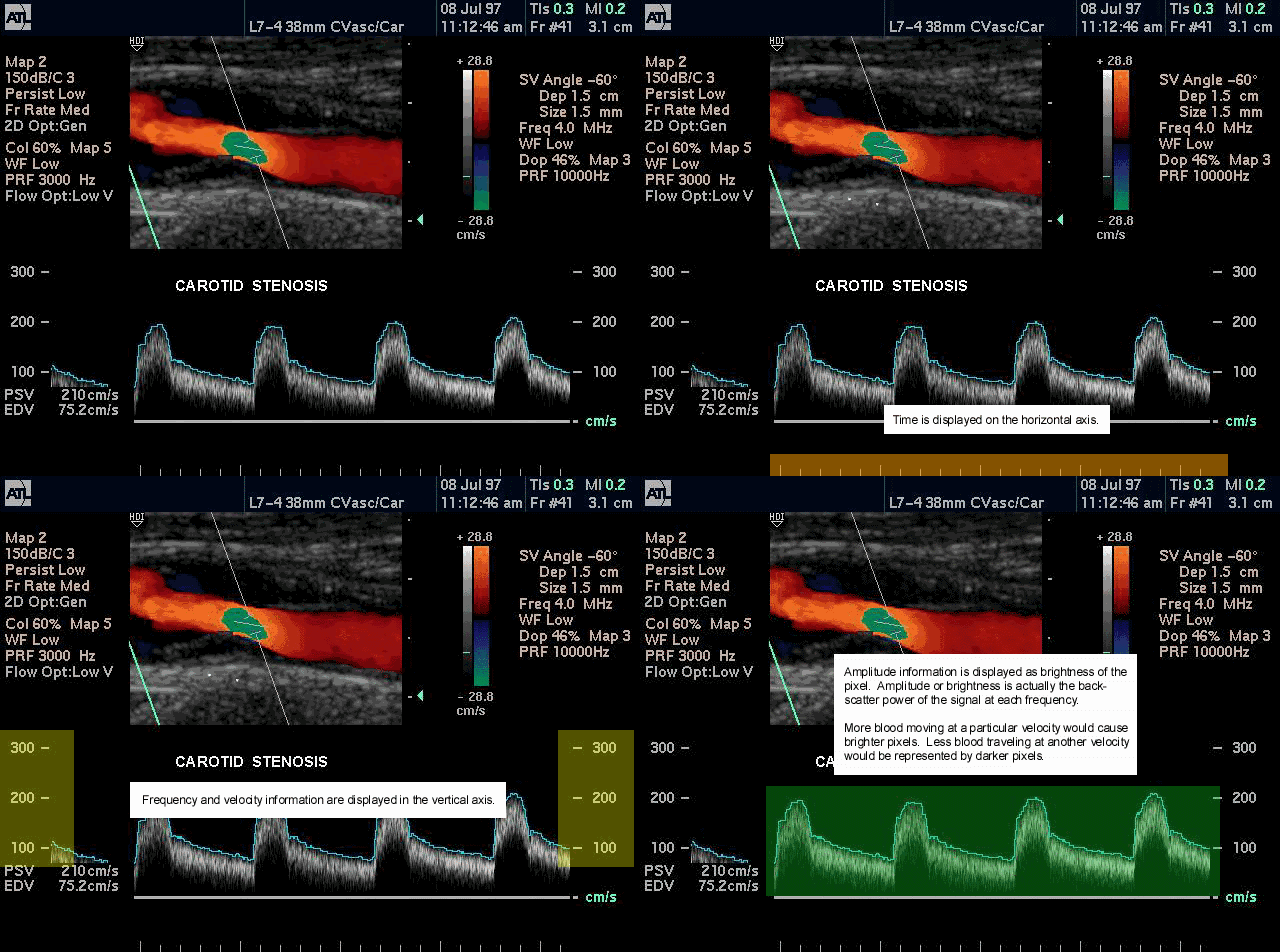
The Doppler signal can be viewed as a waveform using spectral analysis or heard through a loud speaker. Spectral analysis permits easy quantitative assessment. However, the human ear is also a valuable instrument for subtle discrimination. This type of Doppler signal measurement takes a little more practice but should still be relied upon for maximum sensitivity when detecting Doppler shifts. A computer using mathematical techniques such as the fast Fourier transform (FFT) performs the conversion of the Doppler signal into spectral analysis. Red blood cells measure only 7 m, the ultrasound pulse wavelength is 0.2 mm - 0.5 mm, therefore it is not possible for detection of individual red blood cells. The Raleigh scattering effect assumes that each blood cell acts as an individual receiver and scatterer of sound waves. The waves generated from each blood cell meet at points and combine to produce stronger sound wave patterns. This relationship is further defined by the equation, intensity is proportional to frequency of the sound waves to the fourth power ( I ~ f4 ). In other words, doubling the ultrasound transmit frequency creates echoes that are 16 times stronger. Selecting a transducer with a higher Doppler frequency improves your detection of blood flow. However choosing higher frequencies also limits depth penetration, so a compromise must be reached between attenuation and sensitivity. For this reason Doppler frequencies are often lower than the imaging frequencies of the transducer. The components of a Doppler signal are: Amplitude Frequency/Velocity Time

|