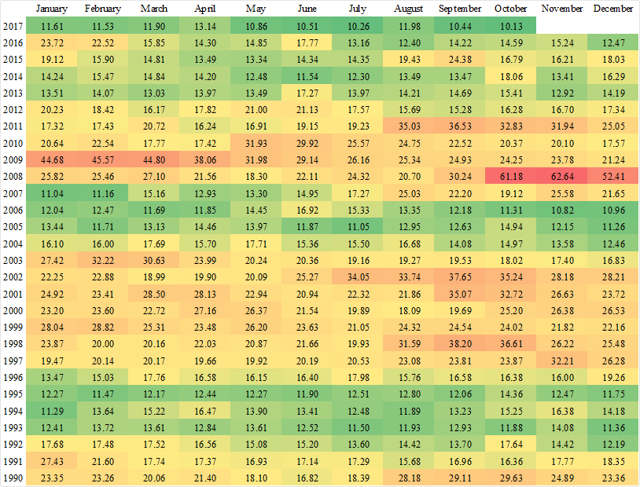
We are all acutely aware that equity market volatility has been historically low. How low? To answer that question, I calculated the average level of the CBOE Volatility Index, or VIX, for each month dating back to my earliest available data from 1990. The VIX, colloquially termed as the "fear gauge", is a key measure of the market's expectation of near-term volatility as conveyed by option prices on the S&P 500 (SPY). How low was market-implied volatility in October? It was the lowest average monthly level in my dataset.
What does this mean for U.S. equity investors? Examining previous periods of very low volatility may offer us some clues. Volatility was uniquely low in 1994-1995, the heart of an extended economic expansion following a shallow recession in 1990-1991. Stock prices continued to soar through the bursting of the tech bubble in the early 2000s.
Another period of ultra low volatility occurred from 2005 to mid-2007. We all know how that turned out - a prelude to a deep recession in 2008 and 2009. The pickup in volatility in August 2007 was subsequent to the failure of two Bear Stearns hedge funds in mid-July, the unofficial start of the subprime crisis. In the data, mid-2007 appears to be an inflection point with elevated volatility culminating in the historic correction in late 2008.
What did I take away from this study? Equity volatility does not change from ultra-low to high overnight. With equity volatility historically low, do not expect a sharp economic or financial market correction absent some exogenous shock. While equity multiples in the U.S. continue to be historically extended, we could continue to see low volatility and rising stock prices over the next 12 months. When equity volatility persists at an above-average rate for an extended period of time - as it did in 1999 and late 2007 and early 2008 - it may be time to pare your risk and accumulate dry powder for a correction.
Disclaimer: My articles may contain statements and projections that are forward-looking in nature, and therefore, inherently subject to numerous risks, uncertainties and assumptions. While my articles focus on generating long-term risk-adjusted returns, investment decisions necessarily involve the risk of loss of principal. Individual investor circumstances vary significantly, and information gleaned from my articles should be applied to your own unique investment situation, objectives, risk tolerance and investment horizon.
Disclosure: I am/we are long SPY.
I wrote this article myself, and it expresses my own opinions. I am not receiving compensation for it (other than from Seeking Alpha). I have no business relationship with any company whose stock is mentioned in this article.


