笨狼发牢骚
发发牢骚,解解闷,消消愁


【腾博】
Fake Invoice Doubts Revived as China Trade Skyrockets
Russia Seeks China Support for Rosneft, Blacklisted State Banks
Putin Deals China Winning Hand as Sanctions Power Rival
China-Russia is a match made in heaven, and that’s scary
Anatole Kaletsky May 22, 2014
(旧文)
中俄拟签定总值超600亿美元石油合约,凤凰网,2013年06月21日
中俄拟签总值超600亿美元石油合约,中国经济网,2013年06月21日
中俄签供油协议 俄将向中方出口2700亿美元原油,2013-06-22
【央台】
[国防军事] 《大家谈》 2014年合集
【个人自由】
Glenn Greenwald on TED: Why privacy matters
【亚太峰会习安会】
(2014-09-15)China to mend relations with neighbors before APEC summit: commentary
(经济学人,Oct 4th 2014)Japan and China Edging closer,Who’ll bet on a meeting soon between the leaders of China and Japan?
(经济学人,October 9, 2014)Japan And China Seeking A Limited Truce? – Analysis
(7 Oct 2014)Why a Xi-Abe Meeting Is Not Important
【中国,南亚、中东、东非】
【杂】
When to pull the plug on a dying startup company
【美国民众债务状况】
Total Nonrevolving Credit Owned and Securitized, Outstanding
http://research.stlouisfed.org/fred2/series/NONREVSL
Securitized Consumer Nonrevolving Credit, Outstanding
http://research.stlouisfed.org/fred2/series/NREVNSEC
Total Revolving Credit Owned and Securitized, Outstanding
http://research.stlouisfed.org/fred2/series/REVOLSL
Securitized Consumer Revolving Credit, Outstanding
http://research.stlouisfed.org/fred2/series/REVOLNSEC
Total Consumer Credit Owned and Securitized, Outstanding
http://research.stlouisfed.org/fred2/series/TOTALSL
Securitized Total Consumer Loans, Outstanding
http://research.stlouisfed.org/fred2/series/TOTALSEC
Credit nation? HELOCs up 20.6% year-over-year
LET’S BORROW AGAINST OUR HOMES LIKE IT’S 2006
The Home ATM Is Back: HELOCs Surge To 2008 Levels
Motor Vehicle Loans Owned and Securitized, Outstanding
http://research.stlouisfed.org/fred2/series/MVLOAS
Student Loans Owned and Securitized, Outstanding
http://research.stlouisfed.org/fred2/series/SLOAS
Total Real Estate Loans Owned and Securitized by Finance Companies, Outstanding
http://research.stlouisfed.org/fred2/series/DTRTM
Securitized Real Estate Loans, All Commercial Banks
http://research.stlouisfed.org/fred2/series/SREACBM027NBOG
益博睿(中文网站)关于美国2014年第二季度美国汽车贷款报告。
参见:http://www.zerohedge.com/news/2014-10-13/meet-preferred-subprime-cars-ranking-most-popular-car-loans-and-leases-fico-score
《华人经济学家:美国人家庭平均收入到底多高?》
看来大家觉得这是好文,估计还权威,到处转载,说作者王健是美国达拉斯联邦储备银行高级经济学家,经济学博士。了不起。原文在哪,不知道。中国网站、博客转载(抄)他人的东西,别说出处,往往连作者是谁都不提,要命。
呵呵,看来我的美国私人财富创历史新高也不差,这是里面的插图:
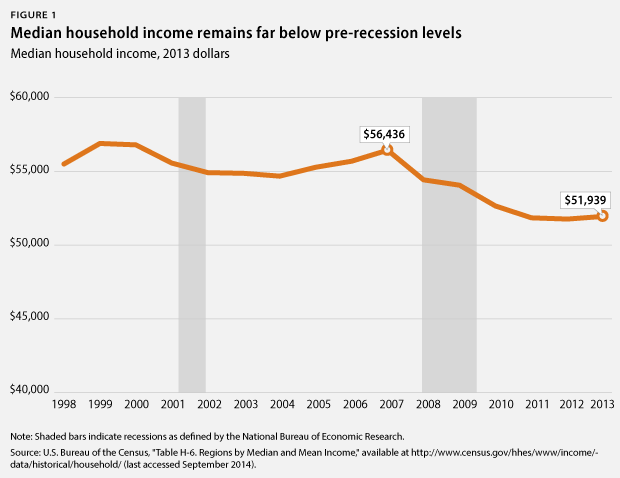
做个笔记。
这是我的美国可支配收入图:
2013年底全国总(可支配)收入十三万亿两千六百六十九一美元($13,266.9B),美国人口大概是三亿一千六百六十九万,故此2013年底人均美国可支配收入是四万一千九百九十六美元(41996,这是均值,不是中值)。一家四口也确实到了十六万多了,按美国人均家庭人口2.6人算,一家是十万九百一十一(10911)美元。无疑,如王文所说,均值不代表贫富分布。
王文接着说起美国人口统计局的美国人口五等分的收入数据。这里有两个初等错误。第一是王把美国经济分析局(Bureau of Economic Analysis)和人口局(Census Bureau)的数据混淆起来了。美国经济分析局说的是所有“可支配收入”,而人口局说的是正常收入。你把王文里的表格的五个数字平均一下,那是73767美元,远不是10911。两者的区别在于可支配收入包括政府救济,如社保、医保。顺便说说,美国政府救济分量很大,我在美国私人财富创历史新高一文里说了,数字也能看出来。我也反复说了,美国经济翻身,美国政府的经济救济是第一大因素。
第二,美国对中产阶级没有明确的定义,不知道“把收入位于40%到80%之间的家庭定义为中产”是否合适。比如中产阶级可指
The American middle class is a social class in the United States.[1][2] While the concept is typically ambiguous in popular opinion and common language use,[3]contemporary social scientists have put forward several more or less congruent theories on the American middle class. Depending on the class model used, the middle class constitutes anywhere from 25% to 66% of households.
上述的维基文资料挺多的。
“Sociologist Leonard Beeghley identifies a male making $57,000 and a female making $40,000 with a combined households income of $97,000 as a typical middle-class family.“
对比一下王说的”美国中产家庭的年收入大概在5万3千到8万4千美元之间“。
王还说”一些人认识美国的成功人士,就把美国夸成人间天堂,甚至编造美国看病上学不要钱的谎言。而另外一些人则片面强调美国负面现象,把美国形容成一个被富人把持,多数人苦不堪言的地狱“,同意,中国人的观点通常较极端。不过美国中产前景也不乐观,参见我的另一篇短文:
美国中产遥遥不见天日
【网站】
Tiananmen's Tremendous Achievements
现在国内刊登、解读国外报道真快,不简单:
解读瑞信2014全球财富报告:最富的10%人口控制了各国多少财富?
2014-10-16 10:23:23
【香料包】
世界香料包
香料包配方
常见香料,常见香料
世界各地香料包产品
A Trip Around The World, By Way Of Seasonings
【你有钱吗?】
Richard E. Grant's Hotel Secrets
http://www.businessweek.com/articles/2014-10-15/chinese-home-buying-binge-transforms-california-suburb-arcadia
【中、印、美总产值比较】
下面是一个分析。
| 总产值(万亿) | 总产值(万亿) | 总产值(万亿) | 总产值(万亿) | 总产值(万亿) | ||||||
| 中国一 | 9 | 印度一 | 1.7 | 印度二 | 1.7 | 美国 | 17 | 中国二 | 9 | |
| 2014 | 8.00% | 9.72 | 8.00% | 1.84 | 8.00% | 1.84 | 3.00% | 17.51 | 8.00% | 9.72 |
| 2015 | 7.50% | 10.45 | 8.00% | 1.98 | 8.00% | 1.98 | 3.00% | 18.04 | 7.60% | 10.46 |
| 2016 | 7.00% | 11.18 | 8.00% | 2.14 | 8.00% | 2.14 | 3.00% | 18.58 | 7.20% | 11.21 |
| 2017 | 6.50% | 11.91 | 8.00% | 2.31 | 8.00% | 2.31 | 3.00% | 19.13 | 6.80% | 11.97 |
| 2018 | 6.00% | 12.62 | 8.00% | 2.50 | 8.00% | 2.50 | 3.00% | 19.71 | 6.40% | 12.74 |
| 2019 | 5.50% | 13.32 | 8.00% | 2.70 | 8.00% | 2.70 | 3.00% | 20.30 | 6.00% | 13.50 |
| 2020 | 5.00% | 13.98 | 8.00% | 2.91 | 8.00% | 2.91 | 3.00% | 20.91 | 5.60% | 14.26 |
| 2021 | 4.50% | 14.61 | 8.00% | 3.15 | 8.00% | 3.15 | 3.00% | 21.54 | 5.20% | 15.00 |
| 2022 | 4.00% | 15.20 | 8.00% | 3.40 | 8.00% | 3.40 | 3.00% | 22.18 | 4.80% | 15.72 |
| 2023 | 3.50% | 15.73 | 8.00% | 3.67 | 8.00% | 3.67 | 3.00% | 22.85 | 4.40% | 16.41 |
| 2024 | 3.00% | 16.20 | 7.50% | 3.95 | 8.00% | 3.96 | 3.00% | 23.53 | 4.00% | 17.07 |
| 2025 | 2.50% | 16.60 | 7.00% | 4.22 | 8.00% | 4.28 | 3.00% | 24.24 | 4.00% | 17.75 |
| 2026 | 2.00% | 16.94 | 6.50% | 4.50 | 8.00% | 4.62 | 3.00% | 24.97 | 4.00% | 18.46 |
| 2027 | 2.00% | 17.27 | 6.00% | 4.77 | 8.00% | 4.99 | 3.00% | 25.71 | 4.00% | 19.20 |
| 2028 | 2.00% | 17.62 | 5.50% | 5.03 | 8.00% | 5.39 | 3.00% | 26.49 | 4.00% | 19.97 |
| 2029 | 2.00% | 17.97 | 5.00% | 5.28 | 8.00% | 5.82 | 3.00% | 27.28 | 4.00% | 20.77 |
| 2030 | 2.00% | 18.33 | 5.00% | 5.54 | 8.00% | 6.29 | 3.00% | 28.10 | 4.00% | 21.60 |
| 2031 | 2.00% | 18.70 | 5.00% | 5.82 | 8.00% | 6.79 | 3.00% | 28.94 | 4.00% | 22.46 |
| 2032 | 2.00% | 19.07 | 5.00% | 6.11 | 8.00% | 7.34 | 3.00% | 29.81 | 4.00% | 23.36 |
| 2033 | 2.00% | 19.45 | 5.00% | 6.42 | 8.00% | 7.92 | 3.00% | 30.70 | 4.00% | 24.30 |
| 2034 | 2.00% | 19.84 | 5.00% | 6.74 | 8.00% | 8.56 | 3.00% | 31.63 | 4.00% | 25.27 |
| 2035 | 2.00% | 20.24 | 5.00% | 7.07 | 8.00% | 9.24 | 3.00% | 32.57 | 4.00% | 26.28 |
| 2036 | 2.00% | 20.64 | 5.00% | 7.43 | 8.00% | 9.98 | 3.00% | 33.55 | 4.00% | 27.33 |
| 2037 | 2.00% | 21.06 | 5.00% | 7.80 | 8.00% | 10.78 | 3.00% | 34.56 | 4.00% | 28.42 |
| 2038 | 2.00% | 21.48 | 5.00% | 8.19 | 8.00% | 11.64 | 3.00% | 35.59 | 4.00% | 29.56 |
| 2039 | 2.00% | 21.91 | 5.00% | 8.60 | 8.00% | 12.57 | 3.00% | 36.66 | 4.00% | 30.74 |
| 2040 | 2.00% | 22.35 | 5.00% | 9.03 | 8.00% | 13.58 | 3.00% | 37.76 | 4.00% | 31.97 |
| 2041 | 2.00% | 22.79 | 5.00% | 9.48 | 8.00% | 14.67 | 3.00% | 38.89 | 4.00% | 33.25 |
| 2042 | 2.00% | 23.25 | 5.00% | 9.95 | 8.00% | 15.84 | 3.00% | 40.06 | 4.00% | 34.58 |
| 2043 | 2.00% | 23.71 | 5.00% | 10.45 | 8.00% | 17.11 | 3.00% | 41.26 | 4.00% | 35.97 |
| 2044 | 2.00% | 24.19 | 5.00% | 10.98 | 8.00% | 18.48 | 3.00% | 42.50 | 4.00% | 37.41 |
| 2045 | 2.00% | 24.67 | 5.00% | 11.52 | 8.00% | 19.95 | 3.00% | 43.78 | 4.00% | 38.90 |
| 2046 | 2.00% | 25.17 | 5.00% | 12.10 | 8.00% | 21.55 | 3.00% | 45.09 | 4.00% | 40.46 |
| 2047 | 2.00% | 25.67 | 5.00% | 12.71 | 8.00% | 23.27 | 3.00% | 46.44 | 4.00% | 42.08 |
| 2048 | 2.00% | 26.18 | 5.00% | 13.34 | 8.00% | 25.14 | 3.00% | 47.84 | 4.00% | 43.76 |
| 2049 | 2.00% | 26.71 | 5.00% | 14.01 | 8.00% | 27.15 | 3.00% | 49.27 | 4.00% | 45.51 |
| 2050 | 2.00% | 27.24 | 5.00% | 14.71 | 8.00% | 29.32 | 3.00% | 50.75 | 4.00% | 47.33 |
| 2051 | 2.00% | 27.79 | 5.00% | 15.44 | 8.00% | 31.66 | 3.00% | 52.27 | 4.00% | 49.22 |
| 2052 | 2.00% | 28.34 | 5.00% | 16.22 | 8.00% | 34.20 | 3.00% | 53.84 | 4.00% | 51.19 |
| 2053 | 2.00% | 28.91 | 5.00% | 17.03 | 8.00% | 36.93 | 3.00% | 55.45 | 4.00% | 53.24 |
| 2054 | 2.00% | 29.49 | 5.00% | 17.88 | 8.00% | 39.89 | 3.00% | 57.12 | 4.00% | 55.37 |
| 2055 | 2.00% | 30.08 | 5.00% | 18.77 | 8.00% | 43.08 | 3.00% | 58.83 | 4.00% | 57.58 |
| 2056 | 2.00% | 30.68 | 5.00% | 19.71 | 8.00% | 46.52 | 3.00% | 60.60 | 4.00% | 59.89 |
| 2057 | 2.00% | 31.29 | 5.00% | 20.70 | 8.00% | 50.25 | 3.00% | 62.41 | 4.00% | 62.28 |
| 2058 | 2.00% | 31.92 | 5.00% | 21.73 | 8.00% | 54.26 | 3.00% | 64.29 | 4.00% | 64.77 |
| 2059 | 2.00% | 32.55 | 5.00% | 22.82 | 8.00% | 58.61 | 3.00% | 66.22 | 4.00% | 67.36 |
| 2060 | 2.00% | 33.21 | 5.00% | 23.96 | 8.00% | 63.29 | 3.00% | 68.20 | 4.00% | 70.06 |
| 2061 | 2.00% | 33.87 | 5.00% | 25.16 | 8.00% | 68.36 | 3.00% | 70.25 | 4.00% | 72.86 |
| 2062 | 2.00% | 34.55 | 5.00% | 26.41 | 8.00% | 73.83 | 3.00% | 72.36 | 4.00% | 75.78 |
| 2063 | 2.00% | 35.24 | 5.00% | 27.73 | 8.00% | 79.73 | 3.00% | 74.53 | 4.00% | 78.81 |
【经济预测】
OECD(长期)
Main
Looking to 2060: Long-term global growth prospects
LOOKING TO 2060: A GLOBAL VISION OF LONG-TERM GROWTH
Policy Challenges for the Next 50 Years
SHIFTING GEAR: POLICY CHALLENGES FOR THE NEXT 50 YEARS
Global Trade and Specialisation Patterns Over the Next 50 Years
Policy Challenges for the Next 50 Years
IMF(短期)
Main
2014年4月西半球:Regional Economic Outlook
Regional Main
OCT 14:World Economic Outlook:Legacies, Clouds, Uncertainties (World Economic and Financial Surveys)
Update
Annual Reports
彭博:Asia Stocks Decline After IMF Cuts Global Growth Forecast
