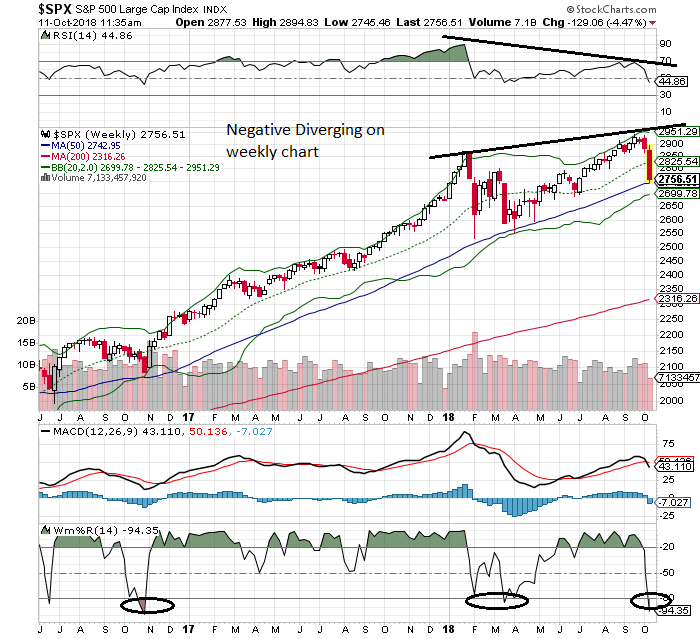
Whenever this is a negative diverging on chart, usually price will move against current trend soon. As we saw that market is sold off heavily in last few days. There are some good news and bad news. The good news is that market is currently at oversold condition although complete wash out hasn't happened yet (maybe in a few days). Usually when TA indicators get into this terriotory, it is usually close to near term bottom. The bad news is that, this negative diverging likely to have mid term impact. Meaning after next market bounce (May be year end rally), early next year will be very tough. It might make current sell off look like nothing. But this all depends on FED at this moment.
Some people suggest that FED won't raise rate in Dec. If that is the case, market might be able to overcome this negative diverging. But if FED does raise rate again in DEC, I would think that there will be much more downside risk.
So take it easy when you try to catch this bottom (leave more dry powder at hand) and reduce some positions if year end rally comes.
There is a probability that we already see the top of this 10 yr bull market. It doesn't mean we will see big bear market right away. But our expectation have to be reduced (it is no longer 2017 when nothing could go wrong).
Is there a case to sell everything? I think not. If you have time and have right allocations, you can ride through bear markets (2000, 2008...)