只有想不到,没有做不到
投资,股票,计算机


Many retail traders that I know shy away from trading options. There’s this stigma surrounding them that they are “risky” and an easy way to lose money. I’m not here to change your mind about options, but what I can do is show you how you can use readily available information on the options market to inform your stock trading decisions. By learning how to read options chains, you uncover market expectations for the underlying stock. Here you will learn how to merge options chain data with a stock’s chart to give you clear areas of potential support, resistance and time frames for you equity trades.
How to Read an Options Chain
An options chain details the prices, open interest and daily volume for several options contracts all on one page. The view I chose to use is known as the straddle view. The straddle view gives me the prices for all the call options and put options at various strike prices.
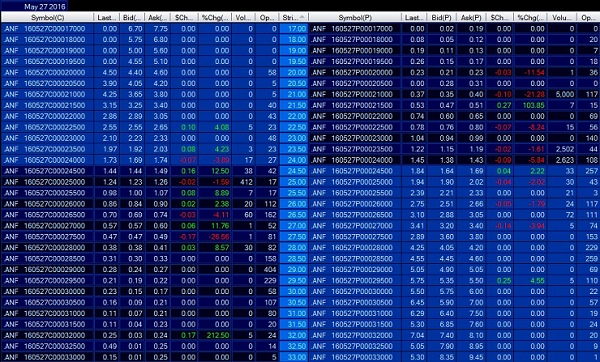
On the top of the options chain you can select which expiration you want to view. This is the first step in deciding how to trade using this chain. What I like to do is find a major upcoming event then find the expiration that’s just after that date. For example, I often use chains which expire just after an earnings report. This helps me understand what sort of move the options are pricing in. We’ll go into this in detail a little later on.
Once you have your expiration set, you’ll see two distinct sides to the straddle view, call options and put options. To simplify, call options give the buyer the right to buy 100 shares of the underlying stock at a specified strike price. Put options give the buyer the right to sell 100 shares of the underlying stock at a specified strike price. The strike price on the options chain in straddle view is typically down the middle of the page.
Then just like a stock, options have a bid, an ask, a last price traded and daily volume. Most options are not as liquid as individual stocks to you’ll notice the spread between the bid and the ask is much greater than with a stock. You’ll also see how much lower the volume is. For my calculations, I use the last price traded.
The most important piece of information on the options chain is the open interest. This is the number of contracts outstanding that have not yet been liquidated by an offsetting trade or an exercise or assignment. The way I like to think about open interest is it’s the total number of contracts that still have a chance to make money. The higher the open interest, the more skin is in the game at that price. It’s this fact that makes open interest so important in determining areas of support and resistance. You know the strike price at which the most options players are betting on.
Using Options Chains to Make Decisions
Options chains contain a lot of information at a glance. That’s exactly how I want to take in the information too. I don’t spend hours laboring over options chains, making complex calculations and mapping out probability distributions. There are plenty of prop shops that perform these operations. For the sake of my own retail trading activity I like to keep things as simple as possible.
First, I calculate the implied range based on the at-the-money straddle price. This sounds complicated but it’s really quite simple. Look at the strike price that is closest to where the stock is currently trading. Take the last price traded of the call option and add it to the last price traded for the put option. Then divide the sum by the current price. Expressed as a percentage, it gives you an idea of the expected magnitude, in either direction, of the move in the stock.
For example, say XYZ Corp is trading at $10. If the at-the-money call option is trading at 50 cents and the at-the-money put option is trading at 50 cents, adding the two is $1. Divide $1 by $10 and you get a 10% move. So the options chain is pricing in a range of 10% to the upside or 10% to the downside, or looking for a range for XYZ between $8 and $10.
Second, I look for which strikes have the greatest open interest. This tells me the levels where traders have the most skin in the game. I interpret this as the levels where the most people are arguing. If XYZ Corp, still trading at $10, has huge open interest on the $12 call option I’d think that is an area of resistance. The level could also attract the current price because so many traders are interested at that level.
Incorporating the Stock Chart
After taking note of the important strike prices on the options chain, I draw them on the stock chart. What I’m looking for is areas of agreement between support and resistance levels I’ve determined on the stock chart and those evident in the options chain. I use basics to determine levels of support and resistance. I look for previous areas in the chart where bullish moves have died out and areas where a prior selloff may have reversed. I also draw trend lines when they present themselves. Then I’ll draw Fibonacci retracements off of larger moves. Using these tactics, I usually have several levels on my chart.
What’s unique about the options chains is they give me a timeframe for the trade rather than just price levels. You get a feel for what traders are expecting in the short term. This can lead to huge moves or a stock that stalls out. If the options market isn’t expecting much of a move but I see a breakout developing on the chart, this presents a great long opportunity for me.
Another trade I find often is when there is large open interest on a call option that is out-of-the money or has a strike price above the current price. This out-of-the money strike serves as a price target for a long equity position.
Stock Trade Ideas
Abercrombie and Fitch (ANF)
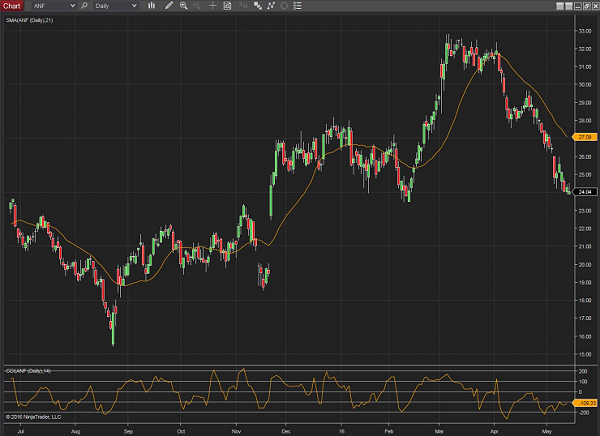
Abercrombie gives us a great example of how options prices inflate ahead of an earnings report. Over the last couple of weeks retail has given us some terrible earnings reports. As a result, there’s been selling across the industry. However, Even without reporting earnings, shares are off from $32 at the beginning of April to just over $24 today.
Looking at the options chain, I see the at-the-money call and put are both trading at $1.80. That implies a 15% expected move on earnings. That corresponds to a range of $20.40 to $27.60. The chart shows support below the current price above $23. Real resistance is well above the current price and outside of the options implied range near $30. Personally, I’m looking to be long heading into earnings with a stop just below $23 and a target price of $27.60.
Dean Foods (DF)

A trade here on Dean Foods extends the time horizon out a little further. Deans recently reported, with EPS coming in at 45 cents versus our Zacks Consensus Estimate calling for 38 cents. Shares are moving in a positive direction after the report, so much so that the September options chain is pricing in a 15% move. To the upside that’s $21.27.
Digging further into the options chain I see that there is an open interest of 214 contracts at $20 but a whopping 596 contracts out at $28. Considering the top end of the 52-week range is a shade over $21 I’d say these contracts are likely to expire worthless. Bullish on this stock, I’d buy with my stop-loss below the 21-day moving average at $17.50 and a target at $21.27.
Molson Coors (TAP)

Molson Coors has seen earnings estimates rise as a direct result of its acquisition of MillerCoors, a joint partnership previously operated with SAB Miller. Shares have been butting up against resistance at the century mark. TAP won’t report earnings again until August 4th so I’m looking at the October options chain for clues of the market sentiment. There are 2,589 call contracts of open interest at the $95 strike, 1,050 at $100 and 1,019 at $115. On the put side, there are 1,006 contracts down at $90.
That $90 level is interesting to me because a dip in April brought shares to just above $91 before the bids came in. I’d be more comfortable waiting for shares to retreat closer to that $95 level to buy. From there, I could park a stop just below $90 with a target price at $110. This sets up a much more favorable risk versus reward scenario than we have today.
Conclusion
It’s important to learn as much information as you can before putting your hard earned money at risk. By understanding how to read an options chain you can take in information on how the market is leaning and what the options market expects. This way you can set up efficient stop losses and price targets on your trades.
