Weekly Chart - MA 20/50 still down, bottom fishing. This is BRK noew holding position, follow the lead :) Strong resistance at $18. 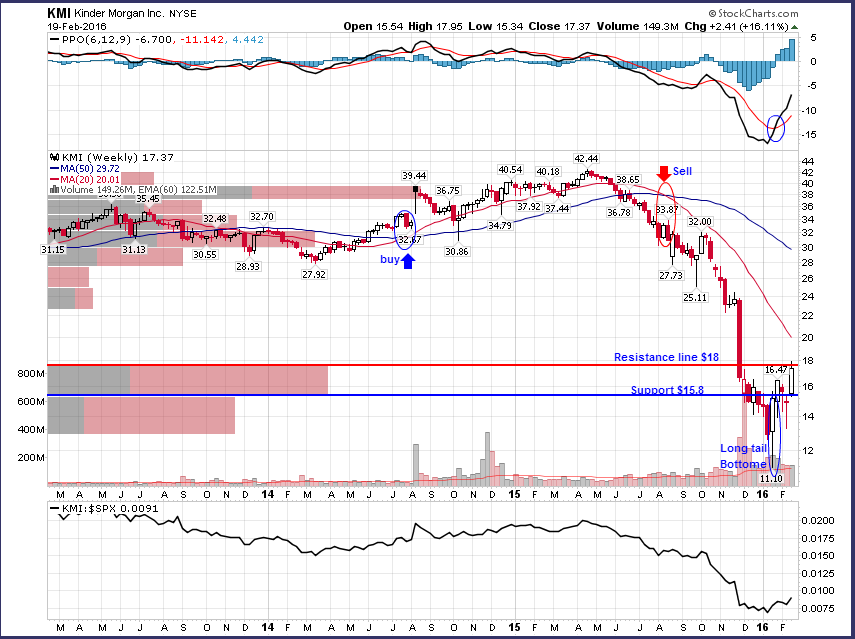
Daily Chart - Formed reverse H&S, MA 20/50 cross up which is a buy signal. The gap at $16 provides a strong support as well. Stop loss if break down $14. 
|