 |
Daily Note:
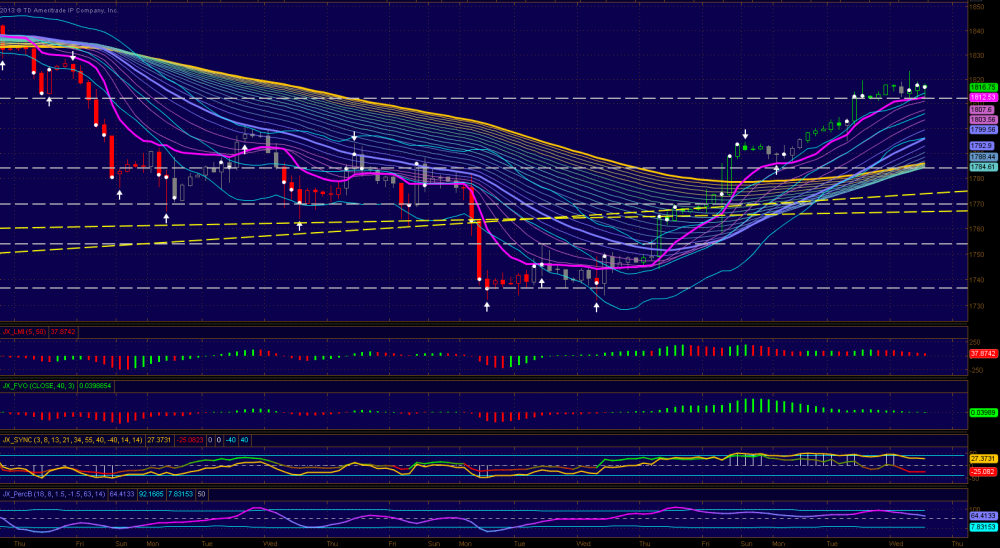
3h Chart: ES traded in a narrow range today tested both the 23 resistance and the 11 support. It closed near 17 level. Pinky on 3h chart is near the key support level and starts to flatten suggesting a sideway action near term. Momentum (LMI) and FVO are weakening throughout the trading session perhaps suggesting weaker price action after a few strong trending days. The daily high was printed by a long tailed candle also suggesting weakness near term. Hence the 11 support is critical if it is penetrated the support will come at 1803, 95 and 85 levels. Resistances are 23, 31 and 44-5 levels.
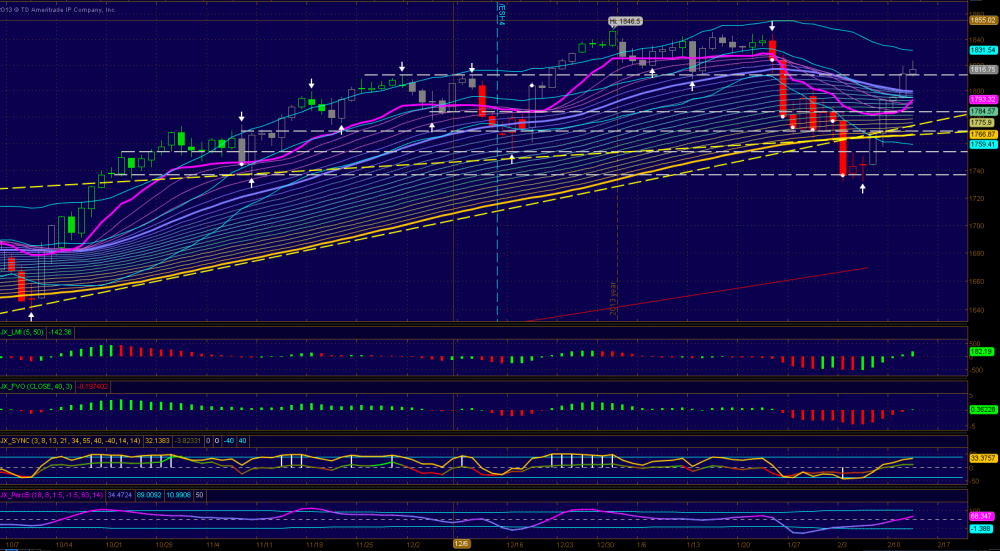
Daily Chart: Both LMI and FVO finally turn green today and indicators are all bullish on daily chart. Pinky is approaching its signal line near 1800 level (support 1803 on 3 hr chart). Rainbow spans from 1767 to 1800 hence >1800 bullish bias and < 1767 bearish bias.
 |
|
|